Overview
Power Plant Monitoring with EMQ* and Edge Insights for Industrial use case delivers a front-to-end solution of time series data collecting, distributing, processing, monitoring, and storage. It is a typical use case in the industrial environment where many industrial sensors (PLCs) generate time series data in different protocols. Industrial gateway software Neuron* can parse these protocols. Rules engine, eKuiper*, can set filters, algorithms to the data stream. EMQX, an MQTT message broker, provides a highly available, high performance messaging service. The data then flows into the TICK stack of Intel® Edge Insights for Industrial (Intel® EII) for data storage and monitoring.
Select Configure & Download to download Edge Insights for Industrial 4.0 with Time Series Use Case and then follow the steps below in Get Started.

Target System Requirements
Minimum System Requirements:
- 8th generation or higher Intel Atom® processor, Intel® Core™ processor, or Intel® Xeon® processor.
- At least 4 GB RAM.
- At least 128 GB hard drive.
- An Internet connection.
- Ubuntu* 20.04
How It Works
Edge Insights for Industrial uses the TICK stack for time-series data analytics. Telegraf*, InfluxDB* and Grafana* are parts of the TICK stack of Intel® EII. In this use case, industrial protocol gateway software Neuron, rules engine eKuiper, and MQTT message broker EMQX can ingest various industrial data before Telegraf in the TICK stack.
The high-level flow of data is as follows: Modbus Simulator -> Neuron -> eKuiper -> EMQX -> Telegraf -> InfluxDB -> Grafana.
- Modbus Simulator generates power plant’s time-series data in Modbus TCP.
- Neuron parses Modbus TCP data.
- eKuiper processes the data stream by adding rules and algorithms.
- EMQX republishes the message in the MQTT protocol in Pub/Sub mode.
- Telegraf is configured to input MQTT and subscribes data from EMQX.
- InfluxDB is connected to Telegraf to store the data.
- Grafana is used for data visualization and monitoring.
When using EMQ IoT messaging software with Intel® EII, all the modules are running on the same node.

Get Started
Prerequisites
Select Configure & Download to download Edge Insights for Industrial 3.0 with Time Series Use Case. For requirements and installation steps, refer to the Edge Insights for Industrial Get Started Guide.
Step 1: Run EII Time Series with EMQ
- Generate EII time series deployment and configuration files:
cd [WORK_DIR]/IEdgeInsights/build python3 builder.py -f usecases/time-series.yml - Build ia_telegraf with new config. Replace [WORK_DIR]/IEdgeInsights/Telegraf/config/Telegraf/Telegraf.conf with Telegraf.conf. MQTT input plugin is configured.
cd [WORK_DIR]/IEdgeInsights/build docker-compose build ia_telegraf - Get docker-compose.yml with EMQ software from docker-compose.yml, and replace [WORK_DIR]/IEdgeInsights/build/docker-compose.yml with the new one.
- Start EII time series use case with EMQX:
cd [WORK_DIR]/IEdgeInsights/build ./docker-compose up -d - Check if all the services are up:
docker ps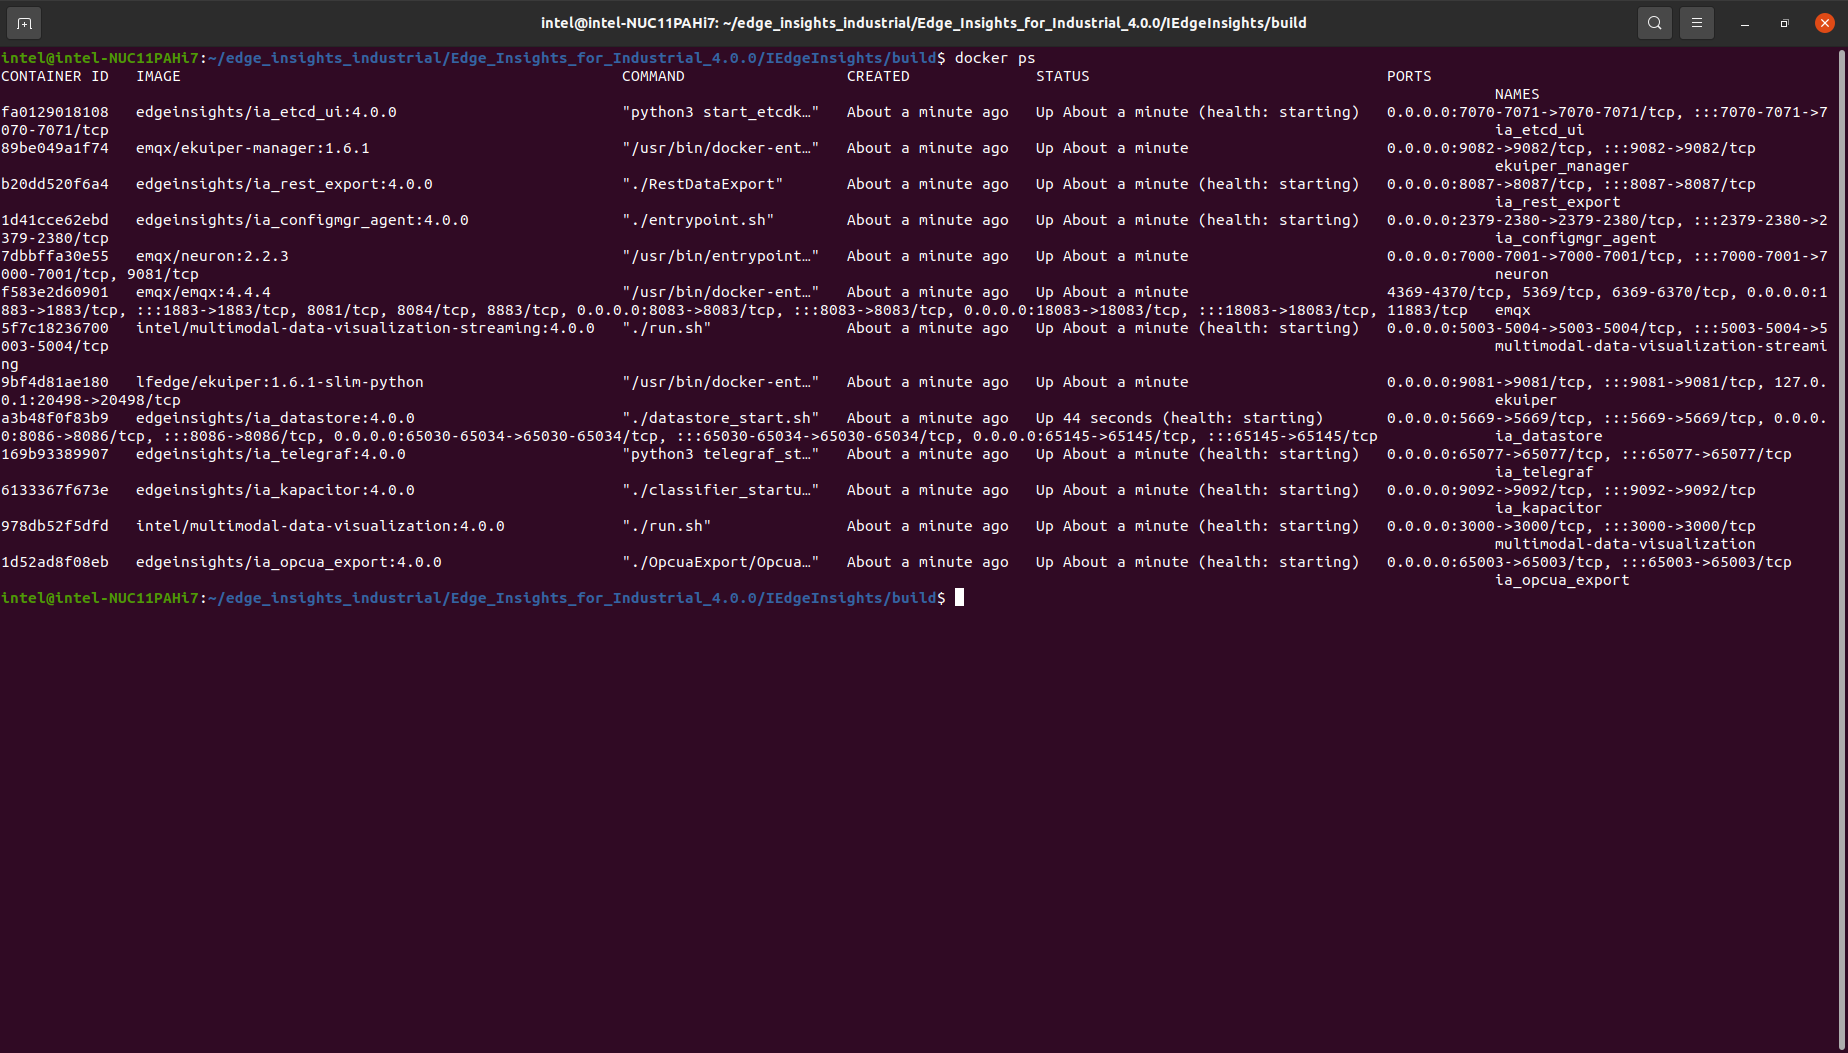
- Start Modbus simulator power_plant_modbus_simulator.py:
sudo pip3 install pymodbus==2.5.3
sudo python3 ./power_plant_modbus_simulator.py
Step 2: Configure Neuron
- Login to Neuron web console at http://localhost:7000 with username: admin and password: 0000.
- Add a south device named battery and a modbus-tcp plugin.
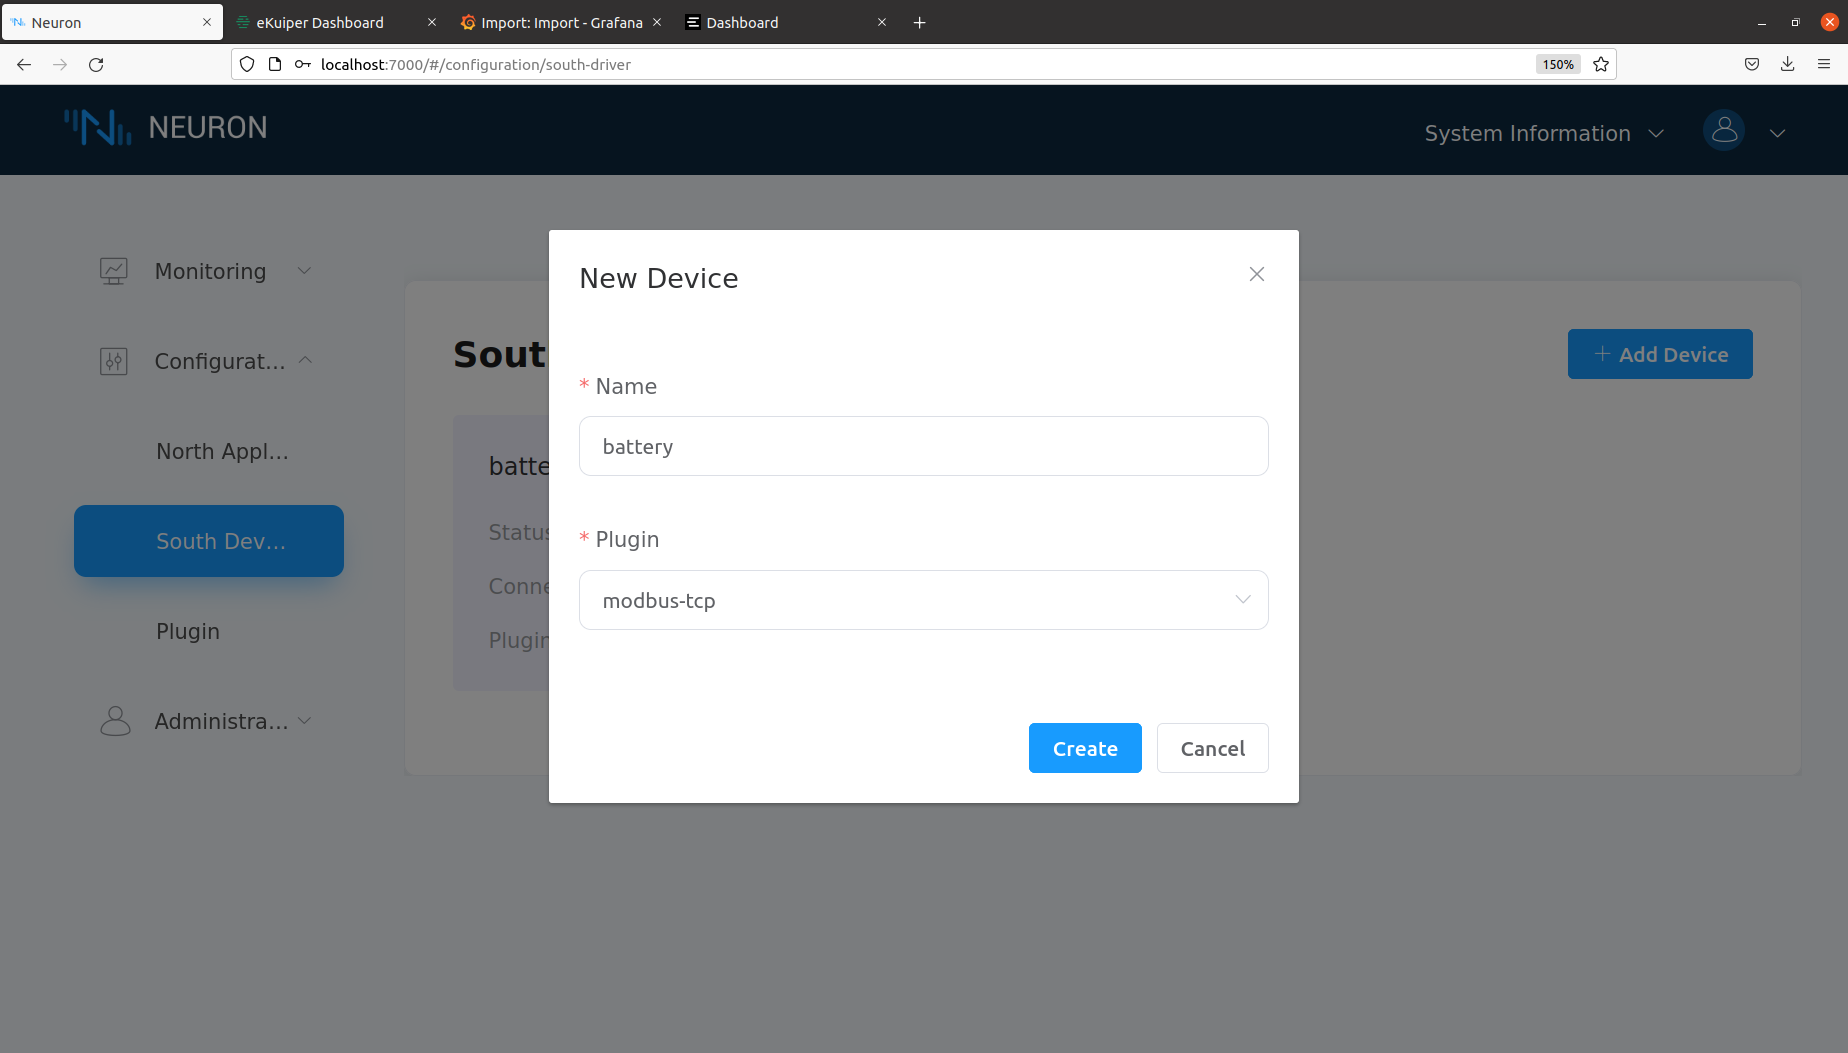
- Click on Device configuration on the battery tab to add configuration. Change the IP address to your host IP.

- Click on the battery tab to add a group. Import a predefined list from upload-tag-template.xlsx.

- Click on the data-stream-processing tab in North application. Add subscription to south device battery.

Step 3: Configure eKuiper
- Install dependencies in the container:
sudo docker exec -it ekuiper /bin/bash pip install numpy==1.22.3 -i http://pypi.douban.com/simple/ --trusted-host pypi.douban.com pip install scipy==1.8.0 -i http://pypi.douban.com/simple/ --trusted-host pypi.douban.com - Download plugin from BatteryAlgs.zip and bcmath.zip. Copy them from host to the container.
sudo docker cp ./bcmath.zip ekuiper:/kuiper/bcmath.zip sudo docker cp ./BatteryAlgs.zip ekuiper:/kuiper/BatteryAlgs.zip - Login to ekuiper web console at http://localhost:9082, with username: admin and password: public.
- Add Service power_plant_demo. Use your host IP for Endpoint.
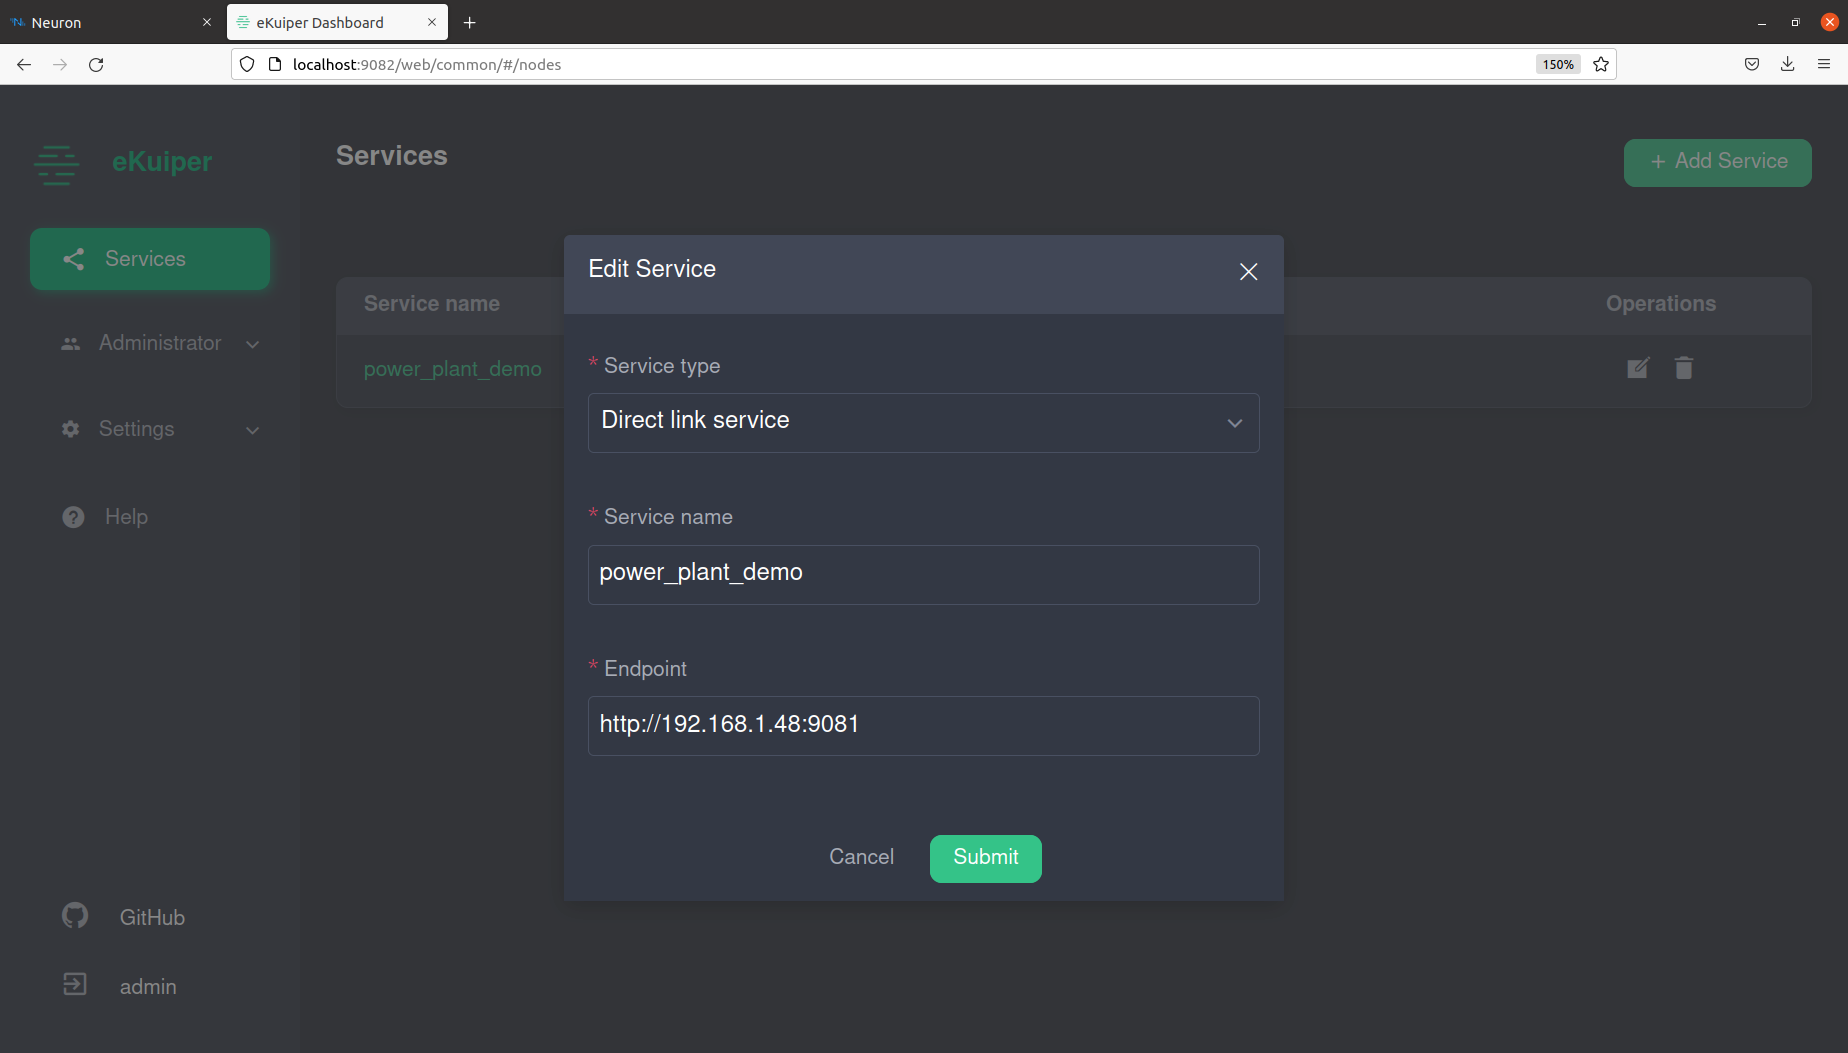
- Click on service(power_plant_demo)->Extension->Portable->Create portable, add portable BatteryAlgs and bcmath.
file:///kuiper/bcmath.zip
file:///kuiper/BatteryAlgs.zip

- Add Streams: NeuronStream, dt1Stream.
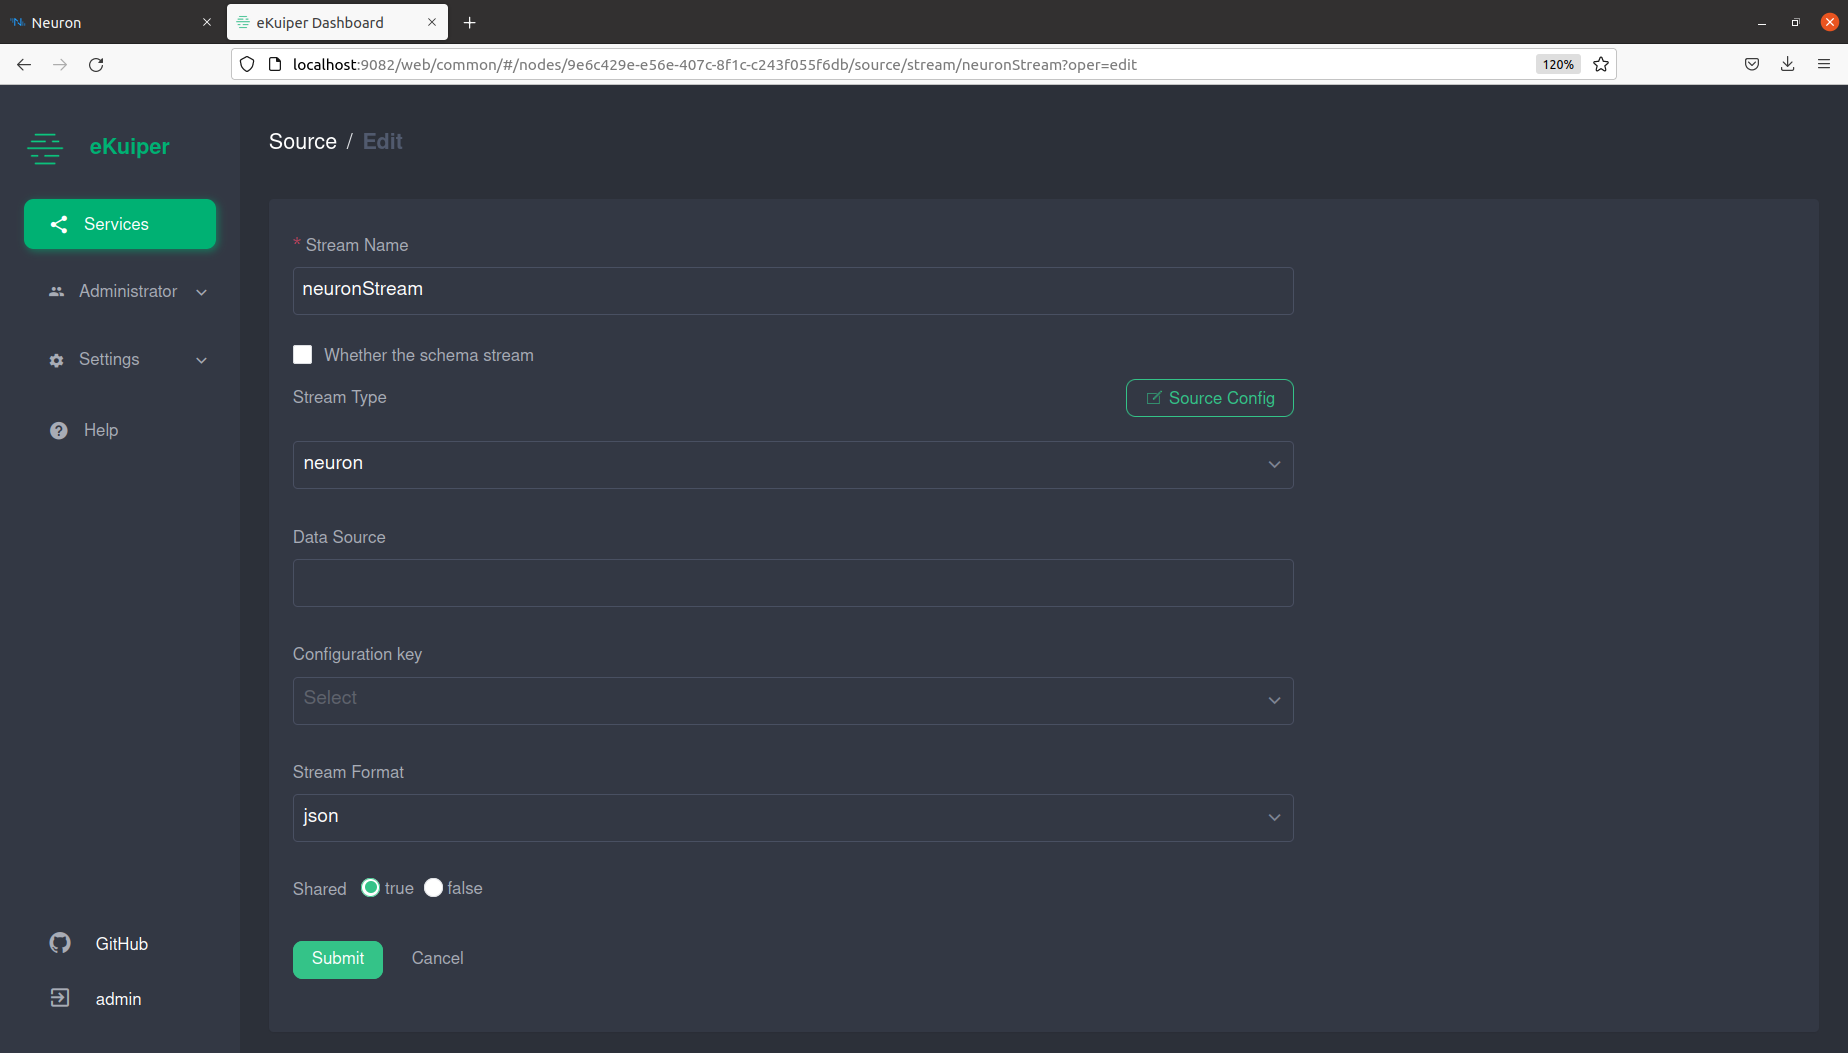

- Add the rules at ekuiper_rules.md.

Step 4: Configure EMQX
- Login to EMQX web console at http://localhost:18083, with username: admin and password: public.
- Add the rules at emqx_rules.md.

Step 5: Configure Grafana
- Login to Grafana web console at https://localhost:3000, with username/password: root / eii23
- Import the dashboard. You can get a pre-defined demo dashboard from grafana_dashboard.json.

- View Data in the demo dashboard.

Summary and Next Steps
This use case showcases the typical workflow and usage of time-series data in the industrial solution.
As a next step, add more rules and algorithms, such as anomaly detection in eKuiper, or add more industrial protocols in Neuron to explore more capabilities.
Learn More
To continue learning, see the following guides and software resources:
- EMQX GitHub*
- Neuron GitHub
- LF eKuiper GitHub
- EMQX Documentation
- Neuron Documentation
- LF eKuiper Documentation
Troubleshooting
- To check if the connections of the Modbus simulator and eKuiper are healthy, find the connection status in Neuron’s web console.


- Monitor the data of the south device.

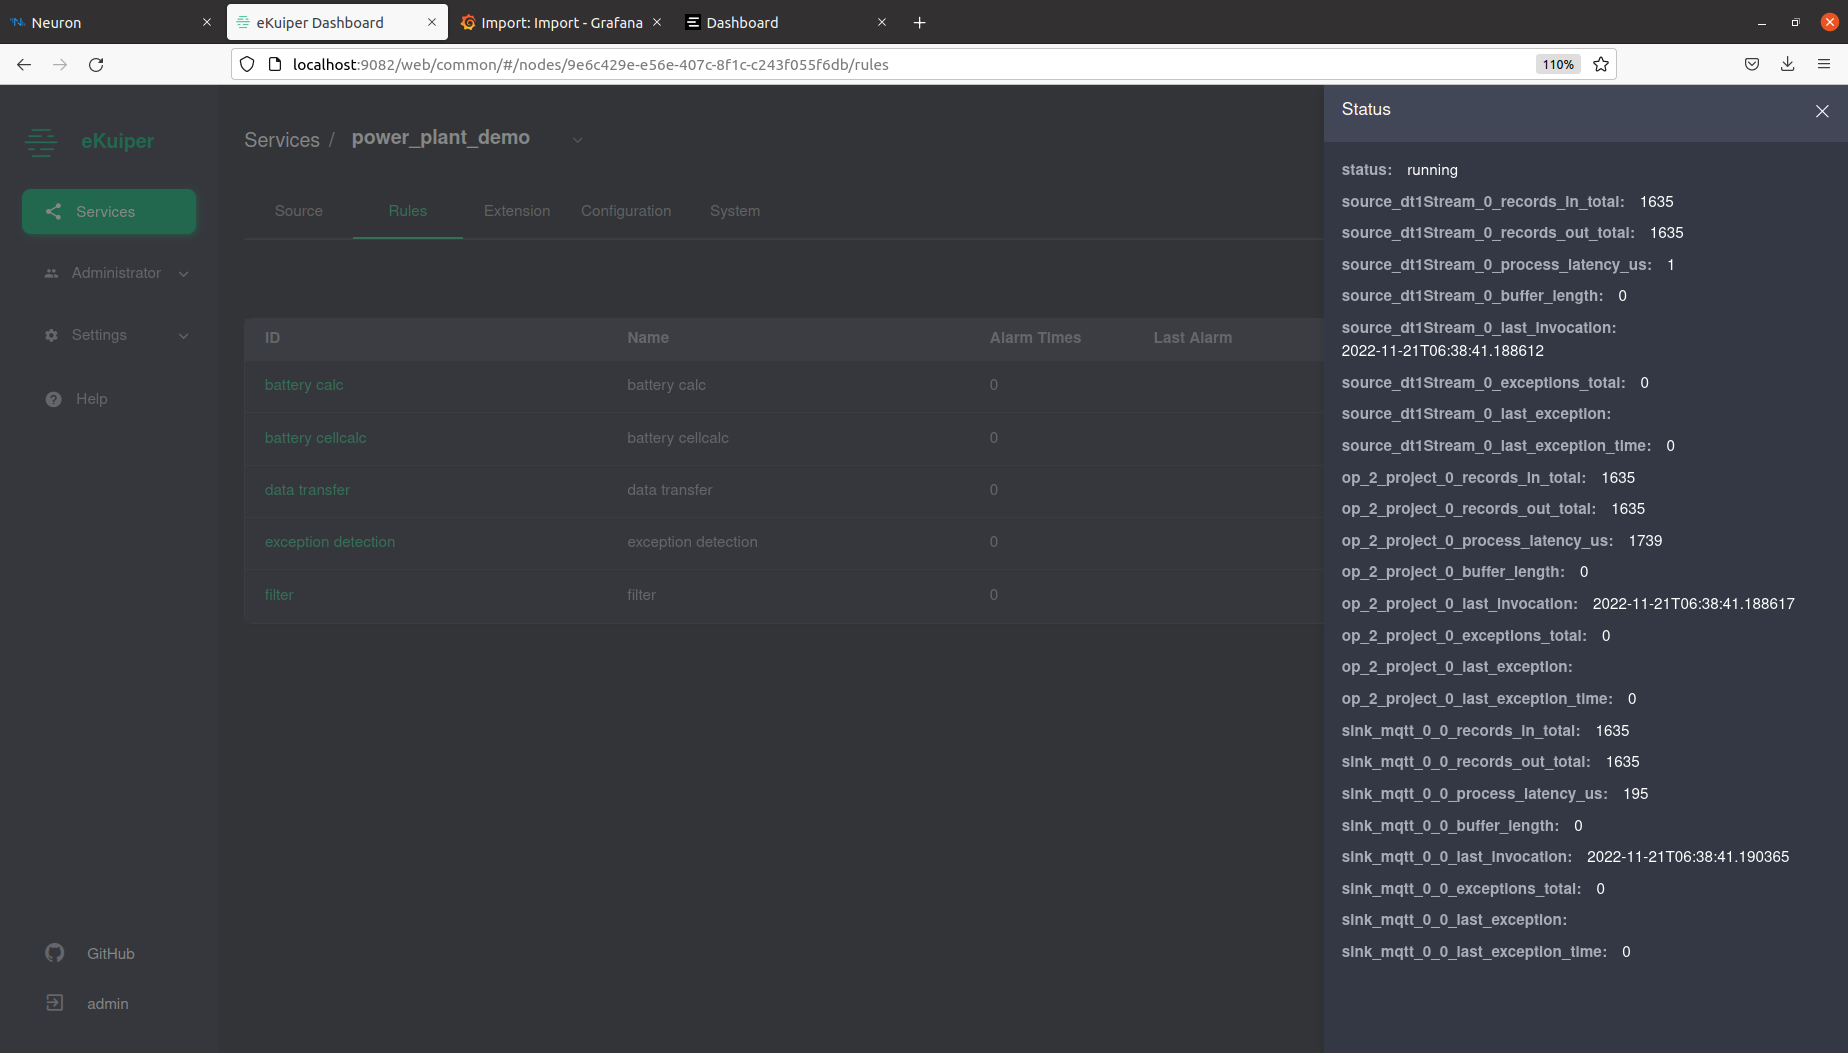
- Check eKuiper rule status to find out rule execution status of each step. You can open the status window by click on the status icon of each rule.
- Use websocket tool in EMQX to subscribe to a topic and to receive messages in real time.


- Print the logs of ia_datastore: docker logs ia_datastore

Support Forum
If you're unable to resolve your issues, visit Forum, Slack or GitHub for technical support of Neuron and EMQX.