What Is a Region?
A region is a slice of a running program. It is demarcated by dynamic start (EVENT_START) and stop (EVENT_STOP) triggers as a program is running. For example, the SDE-PinPlay logger starts recording a pinball on an EVENT_START and stops recording it on an EVENT_STOP.
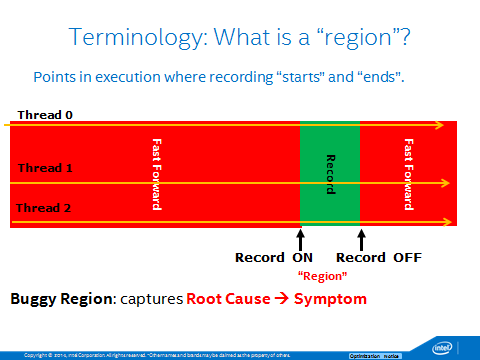
Specify a Region of Interest for Pin and SDE-Based Analyses
PinTools can include $PIN_ROOT/source/tools/InstLib/control_manager.H to define a CONTROL_MANAGER. For details, see the example in $PIN_ROOT/source/tools/InstLibExamples/control.cpp.
A similar use of the CONTROL_MANAGER in SDE can be seen in $SDE_BUILD_KIT/pinkit/sde-example/example/controller-example.cpp.
CONTROL_MANAGER makes available a number of switches to the PinTool (with an optional prefix) that allow specifying EVENT_START and EVENT_STOP event callbacks to the PinTool, and the PinTool can then choose to take some action (such as enable analysis or disable analysis).
Region Triggers from a PinTool
A PinTool can start or stop regions programmatically by calling the following CONTROL_MANAGER method:
//trigger all registered control handlers

//eventID - the Id of the event

//tid - the triggering thread

//bcast - whether this event affects all threads

VOID Fire(EVENT_TYPE eventID, CONTEXT* ctx, VOID * ip, THREADID tid, BOOL bcast);
For example, the gdb_record script invokes the underlying PinPlay-Driver tool with -log:controller_default_start 0 and then the PinPlay-Driver tool triggers EVENT_START/EVENT_STOP whenever (gdb) pin record on and (gdb) pin record off commands are issued by the user.
What Is the Controller?
The controller is a flexible, powerful way for users to define a slice of a running program that they want to be profiled by SDE or an SDE-based tool. Regarding incoming events, the tool is responsible to support the controller events, and define its behavior. See the following details about SDE-based tools support for the controller.
The user can define a set of alarms that trigger events to be fired by the controller. The tool receives these events and acts accordingly.
The controller provides a set of predefined alarms that include:
- icount: instruction count
- address: a real virtual address, a function name (symbol), and image plus offset
- itext: sequence of raw bytes that is interpreted as an instruction
- ssc: a code sequence consisting of two instructions, the first has an immediate that identifies this marker
- int3: an embedded int3 instruction
- isa-extension/isa-category: the running of an instruction that belongs to this XED group (ISA extension or ISA category)
- cpuid: a cpuid instruction with a special input (as defined by the input registers)
- magic: a code sequence also used by other simulation tools that has two input values that identify the marker
- pcontrol: enters the MPI_Pcontrol function with a specific string argument that identifies the marker
- enter_func: entering a function with this name
- exit_func: returning from a function with this name
- interactive: the user interactively sends the event to the process from another window on the same machine
- timeout: number of seconds to trigger event
Details
The controller exposes a knob, -control, which gets the actual definition in a string argument to this knob. This is a flexible way for the user to control the region being profiled by the tool.
The following information describes the behavior of single-threaded applications. An additional paragraph describes multithreaded applications.
Each instance of the -control knob defines an alarm-chain as:
-control <event>:<alarm>:<value>[:count<int>][:tid<int>][:bcast]
This defines that the <event> is fired by the controller once the <alarm> identified by the <value> is run. If :count<int> is used, the event is fired only when the alarm identified by the <value> is executed for the <int> time.
Examples:
-control start:icount:100
The controller fires a start event once 100 instructions are run.
-control stop:address:foo:count3
The controller fires a stop event once we reach the symbol foo for the third time.
Repeat an Alarm Multiple Times
By default, the alarm is armed only once for each thread. Once the event is fired, this thread won't trigger an additional event for this alarm. If one adds the ,repeat:<int> to the end of the alarm, it is activated <int> times. A repeat token without an argument means that the alarm is fired every time it runs.
Example:
-control start:icount:100
The controller fires a start event once 100 instructions run. No more events are fired.
-control start:icount:100,repeat:3
The controller fires a start event once 100 instructions run. Then it re-arms the icount alarm, and fires a start event after additional 100 instructions run. This is repeated. So three start events are fired for each 100 instructions. As opposed to using the :count3 syntax, which fires a single start event, only once the condition of 100 instructions is reached for the third time.
Omitting the repeat count:
-control start:icount:100,repeat
The controller fires a start event every 100 instructions that run.
Multiple Alarms in a Chain
Each instance of the -control knob defines an alarm chain. An alarm chain is a sequence of alarms, separated by the , character, where each alarm is activated only after the previous one was fired. So the , character applies an order between the proceeding alarm and the following alarm.
Example:
-control start:icount:100,stop:address:foo:count3,repeat:2
The controller fires a start event for each thread that reaches icount:100. This then arms the next alarm for that thread. So once a thread reaches the symbol foo for the third time (after reaching icount:100), the controller fires a stop event for that thread. This repeats twice for each thread.
In addition, one can set the entire chain to start only after some other chain has finished, using the ,name:<name> and the ,waitfor:<name> syntax.
Precondition
In some cases, we want the event to be fired only after a certain condition. For example: We want to start an event to be fired when a function foo is called from the function bar. This can be done with the precondition event type. This event doesn't actually call to the tool (in other words, fires an event) but only arms the next alarm in the chain.
Example:
-control precond:address:bar,start:address:foo,stop:icount:100000
The controller arms the start event after calling to the var function. Now, when foo is called the start event is fired and the region starts. The stop event triggers after 100,000 instructions have been run.
Multithreading
The alarm chains are handled separately for each thread. The controller arms the <alarm-type> separately for each thread, and the alarm's value is counted separately for each thread.
If the :tid<int> syntax is used, the preceding alarm is armed only for the thread with the defined thread ID.
If the :global token is used, the alarm is counted in all threads.
Going back to the previous example:
-control start:icount:100
For each thread that reaches an icount of 100, the controller fires a start event to the tool. The event is delivered with the tid of the triggering thread.
To add the :tid<int> syntax, do the following:
-control start:icount:100:tid3
Only when a thread with a pin thread ID 3 reaches the icount of 100, the controller fires the start event to the tool.
Adding the :bcast syntax causes the controller to specify that the event is marked with the broadcast attribute (upon the arrival of the event). The tool can use this information to decide whether to profile all the threads based on this event or only the triggering thread. The effect of adding the bcast syntax depends on the way the tool handles this information. In addition, an alarm defined with bcast, which is notated with the bcast token, will 'arm' the following alarm in the chain for all threads.
The Full Definition of an Alarm Chain
-control <alarm-chain>[,repeat[:<int>]][,name:<name>][,waitfor:<name>]
- alarm-chain ::= <alarm>[,<alarm-chain>]
- alarm ::= <event>:<type>:<value>[:count<int>][:tid<int>][:bcast][:global]
- event ::= start|stop|threadid|precond
- type ::= icount|address|ssc|itext|isa-extension|isa-category|int3|magic|pcontrol|enter_func|exit_func
Values Per Type
- icount: int
- address:
0x<hex address> [pc address]
<name>+<offset> [image + offset]
<name> [symbol/function name] - ssc: hex (SSC markers are special no-OP instructions built into the binary)
- itext: hex (raw bytes of the instruction)
- isa-extension: string (the instructions extension as specified by XED)
- isa-category: string (the instructions category as specified by XED)
- int3: no argument (the int3 instruction is not really run)
- magic: int.int (the instruction xchg ebx,ebx, and input/output values are defined by the numbers)
- pcontrol: string (the second argument to the MPI_Pcontrol function called by the application)
- enter_func: string (bare function name without namespace and parameters)
- exit_func: string (bare function name without namespace and parameters)
- interactive: no argument (see the following information)
- timeout: int (number of seconds)
Note Using the address alarm with image and offset, the + sign is the key to distinguish between a function name and an image name. The image name can be the full path or only the base name of the image.
Using the interactive controller requires two windows: One to run SDE with the application and the interactive controller, and the second to specify the start or stop event by using the controller client. Here is an example:
|
Application |
Control |
|
> <kit>sde –hsw –mix –control start:interactive:bcast,stop:interactive:bcast Main process pid: 32564
|
Start Event > python <kit>/misc/cntrl_client.py /tmp/ctrl_file.32564 Stop Event > python <kit>/misc/cntrl_client.py /tmp/ctrl_file.32564 |
Alarms Accuracy
The controller fires the event once the alarm reaches the triggering condition. The instruction count alarm specifically works in a basic block granularity. The event is fired at the beginning of a basic-block (BBL), when the current icount plus the number of instructions within the BBL exceed the value defined in the controller for triggering the event.
Some events were modified to be more accurate: They are triggers in the specific instructions and not in the basic block: address, ssc, isa-extension, and isa-category.
Note Using the controller for specifying a region of interest for tracing with PinPlay has special handling. The start and stop events always act on all the threads. Due to implementation limitations, there is a small delay between the exact instruction on which the event is fired and when it is actually starts or stops the region.
Special Alarm–Uniform
- uniform:<period>:<length>:<count>
- period: number of instructions before the next sampling starts
- length: number of instructions to sample
- count: number of samples
The alarm can be used to define multiple regions based on instruction count.
Tokens
- repeat[<int>]: Number of iterations of the chain (when no number is provided, it runs in an endless loop).
- count<int>: Delay firing the event to only the Nth running of the alarm (counting happens for each thread unless global is also specified).
- tid<int>: The thread to monitor events on other threads is ignored.
- bcast: Informs the tool that the event is processed for all threads (this behavior is tool specific and is the tool's responsibility).
- name<string>: The name of the chain. Other chains can wait for this chain to finish before they start.
- waitfor<string>: Start the chain only after the chain with the specified name has finished.
- global: Count alarms summary for all threads and not in a specific thread. This token cannot appear with a tid token.
Note If no start event is defined by the user in the command line, a default start event is armed for each thread.
Controller Support in SDE Tools
As previously mentioned, the controller is a self-contained component within SDE. All details relate to when and what events are fired by the controller. This section discusses which SDE tools support using the controller and how they handle events fired by the controller.
Tools That Support the Controller API
- Analysis tools: mix, footprint, align-check, chip-check, debug trace, dynamic-mask-profiler, count, memory-area-cross, sse-checker
- Tracing tool
Analysis Tools
All analysis tools behave similarly: The tools collect data per thread based on the arrival of a start event triggered by that thread. The tool stops the collection of data for that thread when a stop event arrives for that thread. If the tool receives an event with bcast as the tid, rather than the triggering tid, the tool applies this event to all threads.
These events are effective right at the point of arrival.
Tracing Tool
The tracing tool handles a global region. This means that at each given time, we are either in a region and tracing all threads, or we are outside a region and not tracing any thread.
Another special behavior of the tracing tool is the transition from in and out of a region. The effect of the event's arrival isn't immediate. The following is a description of what happens in the tracing tool upon the arrival of a start event:
- Once the thread that caught the event reaches the end of its current BBL, it stops and calls all other threads to stop too.
- Each thread stops at the end of its current BBL.
- Once all threads are stopped, we change the mode to in-region, which means we start generating the trace.
- Resume all threads.
The same goes for stopping the trace generation.
Note The tracing tool ignores any event that arrives between step 1 and 4. The controller behavior is orthogonal to the way the tool handles the events. So, the controller continues firing events based on the alarms defined by the user in the command line. The tracing tool ignores them if a previous event arrived and its processing hasn't been completed yet.
By default, SDE analysis tools follow the same behavior if you run an SDE tool in addition to the tracing tool. You can cancel this by adding -pinplay-control 0 to keep the behavior of the SDE analysis tools as previously described.
Examples
Here are some examples of using the command line to define alarms and events.
>sde –control start:address:foo,stop:addres:bar -- <app>
Start at the symbol foo and stop at the symbol bar.
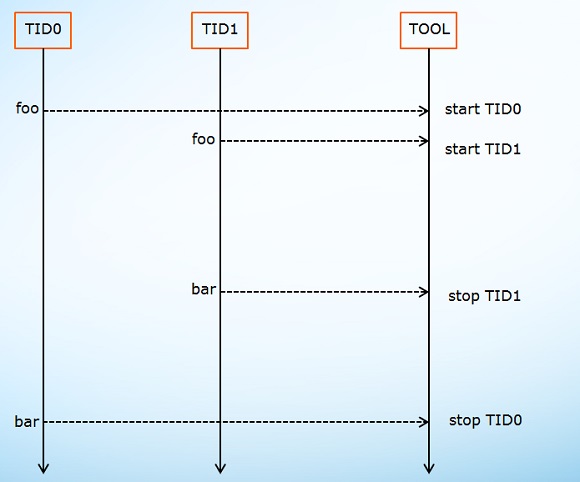
>sde –control start:icount:1000000,stop:icount:100000 -- <app>
Fire a start event after 1M instructions, and then fire a stop after an additional 100K instructions. This is equivalent to:
>sde –skip 1000000 -length 100000 -- <app>

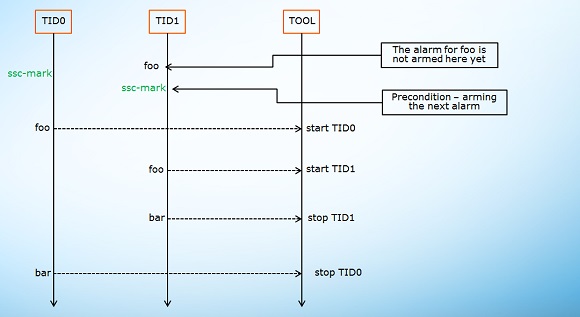
>sde –control precond:ssc:11223344,start:address:foo,stop:addres:bar -- <app>
Start at the symbol foo after the ssc mark 0x11223344, and stop at the symbol bar. (The precond means we don't fire any event, but arm the address:foo alarm only after we reach ssc:11223344.)
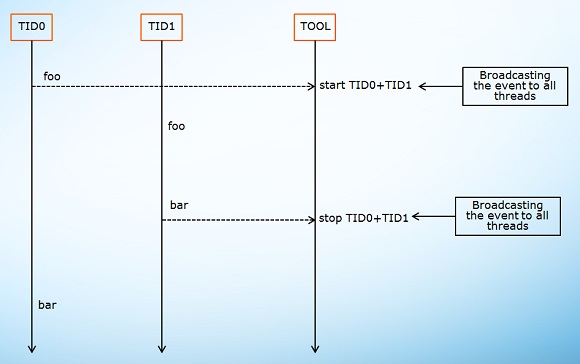
>sde –control start:address:foo,bcast,stop:addres:bar,bcast -- <app>
Start at the symbol foo, fire an event with bcast as the triggering thread, stop at symbol bar, and then fire the event with bcast as the triggering thread. It's the tool's decision and responsibility to handle the bcast differently than the default case.
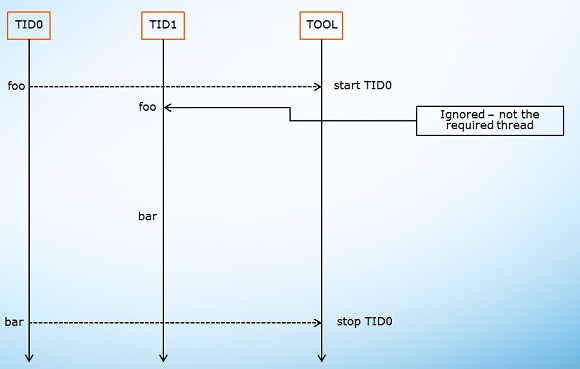
>sde –control start:address:foo:tid0,stop:addres:bar:tid0 -- <app>
Start at the symbol foo, stop at symbol bar, but monitor only tid0. (The controller ignores the fact the tid1 reaches the symbol foo.)
>sde –control precond:icount:200,uniform:800:500:5 -- <app>
Start uniform sampling after 200 instructions. This is the equivalent to the old use:
>sde -uniform-skip 200 -uniform-period 500 -uniform-length 500 -uniform-count 5

>sde –control precond:ssc:11223344,uniform:800:500:5 -- <app>
Start uniform sampling after the ssc mark 0x11223344 instructions.
>sde –control precond:address:foo,precond:address:bar,repeat:2,name:c1 -control start:address:boo,waitfor:c1 -- <app>
Start at symbol foo only after the sequence foo,bar,foo,bar.
>sde –control start:enter_func:foo,stop:exit_func:foo -- <app>
Start at the beginning of function foo and stop when exiting for function foo for this call sequence: A->B->foo->C->D. This captures functions foo,C,D.
>sde –control start:enter_func:foo,stop:exit_func:bar -- <app>
For the call sequence A->bar->foo->C->bar, start at the beginning of function foo and stop when exiting the first bar function.
Note For an exit function event, we always refer to the topmost caller.
>sde –control start:enter_func:foo,stop:exit_func:foo -- <app>
For the call sequence A->foo->foo->foo->foo->C, start at the beginning of the first function foo and stop when exiting the first foo function