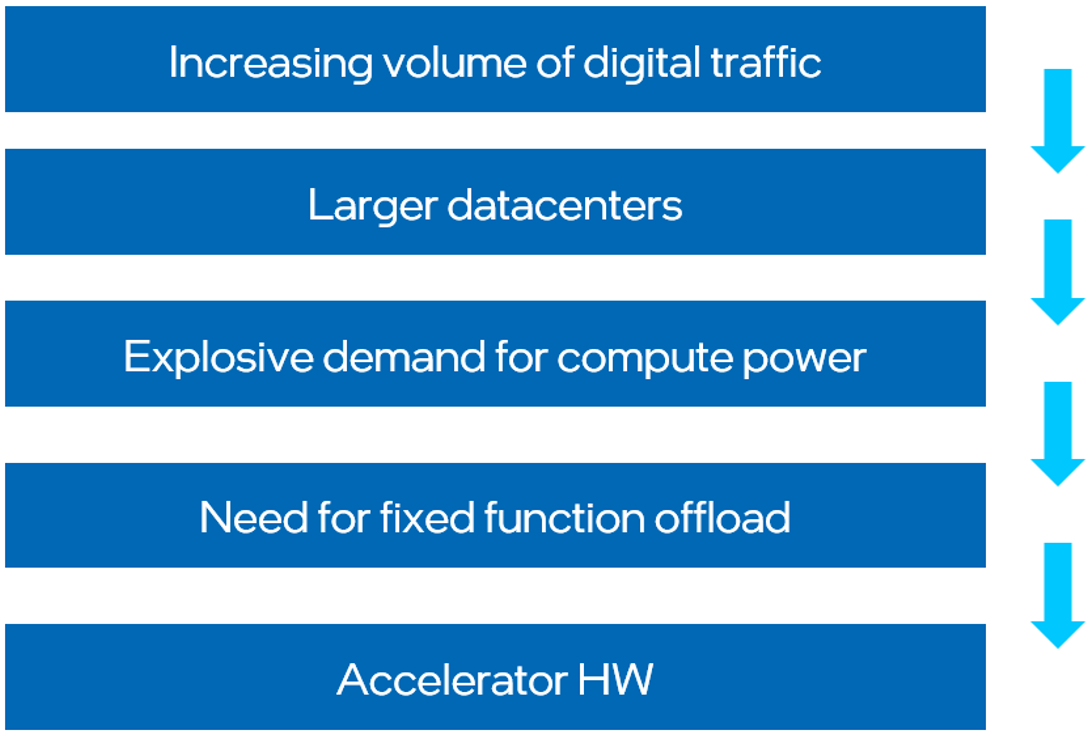
The Need for Accelerators
As the world becomes increasingly online, digital traffic has grown tremendously. This has pushed data centers to be larger than ever, driving an explosive demand for computing. Hardware accelerators for fixed function offloading have become more prevalent to deal with the ever-increasing need for compute power. These compute units are better suited to handle specialized workloads, freeing up general-purpose compute units for other tasks.
Intel® QuickAssist Technology (Intel® QAT), Intel® Dynamic Load Balancer (Intel® DLB), and Intel® Data Streaming Accelerator (Intel® DSA) are a few examples of hardware accelerators. However, these devices pose other challenges to system administrators. They often have a plethora of configuration options that can be tweaked to extract the best performance from these devices. Furthermore, the optimal configuration can vary based on the workloads being run. Quickly applying configurations and replicating these settings at the large scale of a data center can be a challenge to system administrators.
A Plug-in to Manage Complexity
The Intel® Device Manager for VMware* vCenter Server is a plug-in that adds the ability to manage supported devices from within the VMware vCenter Server management software and the vSphere* client interface.
The plug-in allows system admins to view device information, configure devices, and monitor device-specific metrics in real time.
The system administrator can use the plug-in to quickly replicate settings across devices in a data center, greatly reducing the time taken to configure and set up the devices. Real-time monitoring provides information on device health through sensors, and utilization through device-specific telemetry and performance graphs.
The Intel Device Manager for VMware vCenter Server is a powerful plug-in to help system administrators manage, configure, and monitor Intel devices devices at scale. It allows the system admin to:
- View different types of devices from a single interface and configure them.
- See the real-time impact of configuration through device sensors and performance metrics.
- View the health and status of the device along with firmware and driver information.
- Customize the device settings based on the intended scenario.
- Save configurations into recipes and batch-apply them across multiple devices at scale.
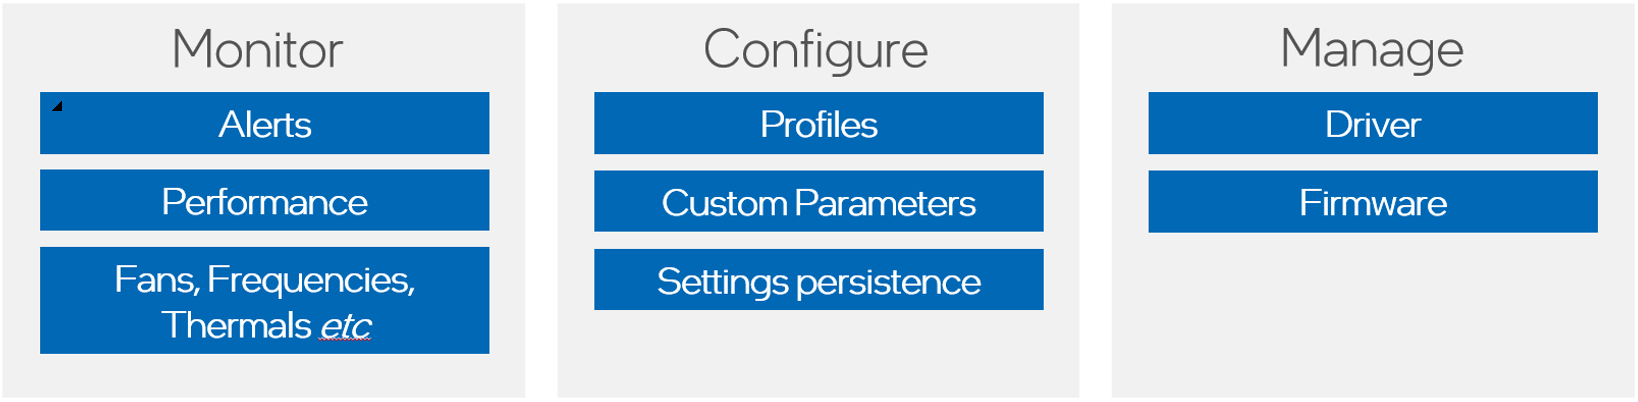
These management options are provided by the plug-in:
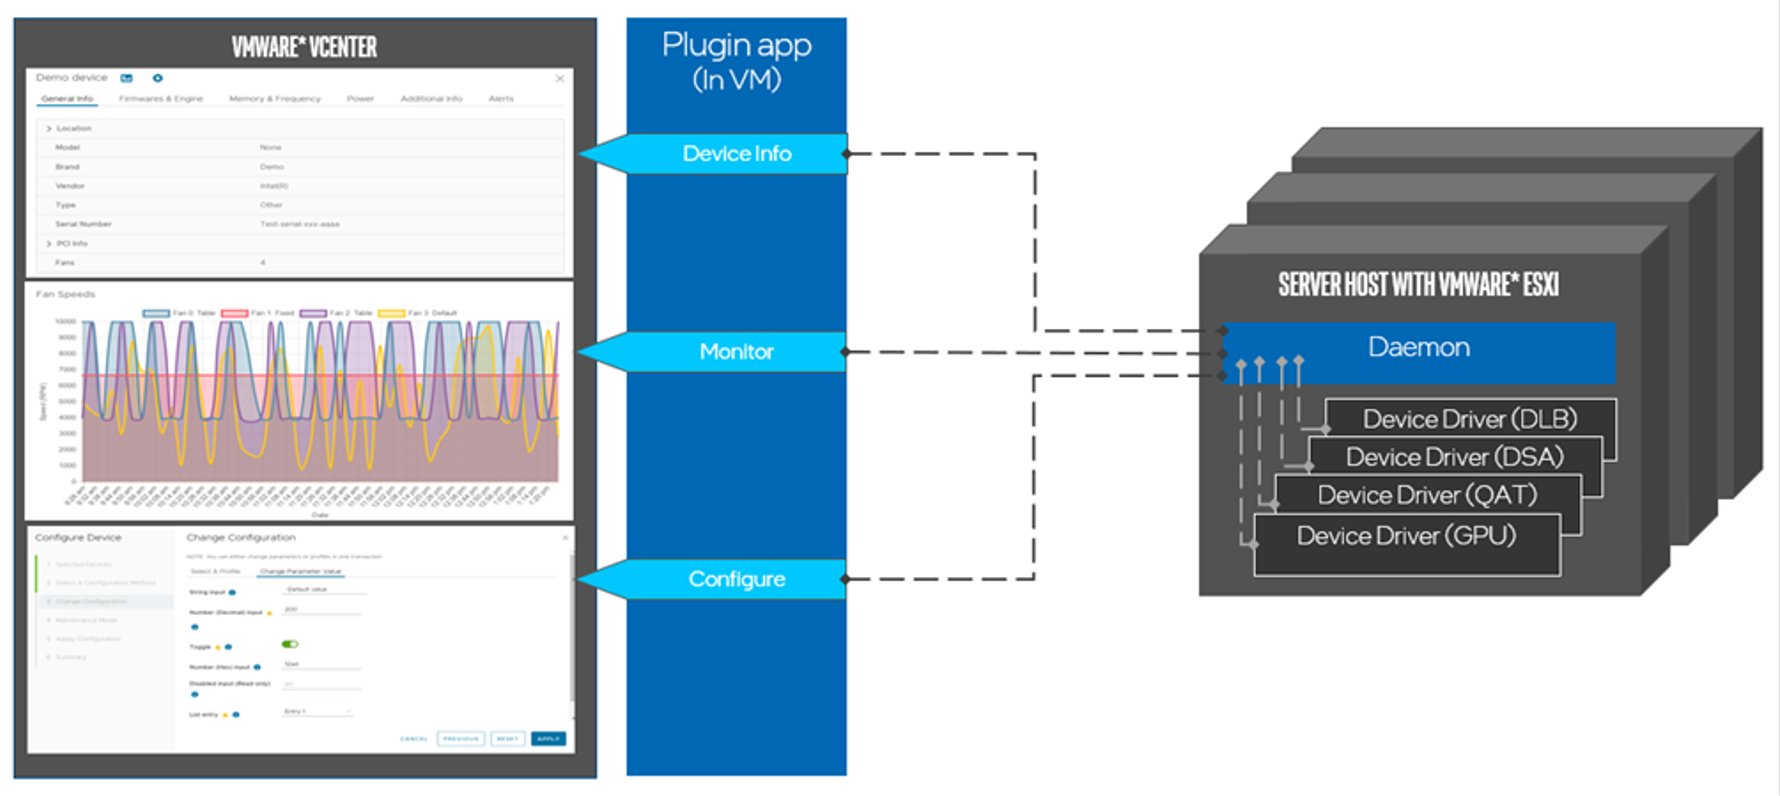
The plug-in is deployed as a VM in vCenter. It enables seamless configuration of devices with the help of the Intel® Accelerator Management Daemon for VMware ESXi*, which allows the plug-in to communicate with device drivers.
Here is an overview of the architecture of a system using the plug-in.
Configure Accelerators Using the Plug-in
The plug-in allows you to save configuration options into recipes for easy replication across devices. This article discusses suggested recipes for the Intel DLB and Intel QAT accelerators. Refer to the Intel Device Manager for VMware vCenter Server User Guide to apply the configurations listed here and save them into recipes.
Intel® Dynamic Load Balancer (Intel® DLB)
The Intel Dynamic Load Balancer (Intel DLB) is a PCIe* device that provides load-balanced, prioritized scheduling of events (packets) across CPU cores, enabling efficient core-to-core communication. It is a hardware accelerator offered by Intel that can be configured with the plug-in and used with supported drivers.
Different recipes control how resources are allocated between the SR-IOV Virtual Functions (VFs). The following table lists the recommended configuration recipes.
|
Recipe |
Description |
SN0 Group Mode |
SN1 Group Mode |
SN0 Slots (Value / Max) |
SN1 Slots (Value / Max) |
|---|---|---|---|---|---|
|
All Provisioned |
Virtual device provisioned with all DLB resources |
0 |
0 |
16/16 |
16/16 |
|
1/2 Provisioned |
Virtual device provisioned with 1/2 of DLB resources |
0 |
0 |
8/16 |
8/16 |
|
1/4 Provisioned |
Virtual device provisioned with 1/4 of DLB resources |
0 |
0 |
4/16 |
4/16 |
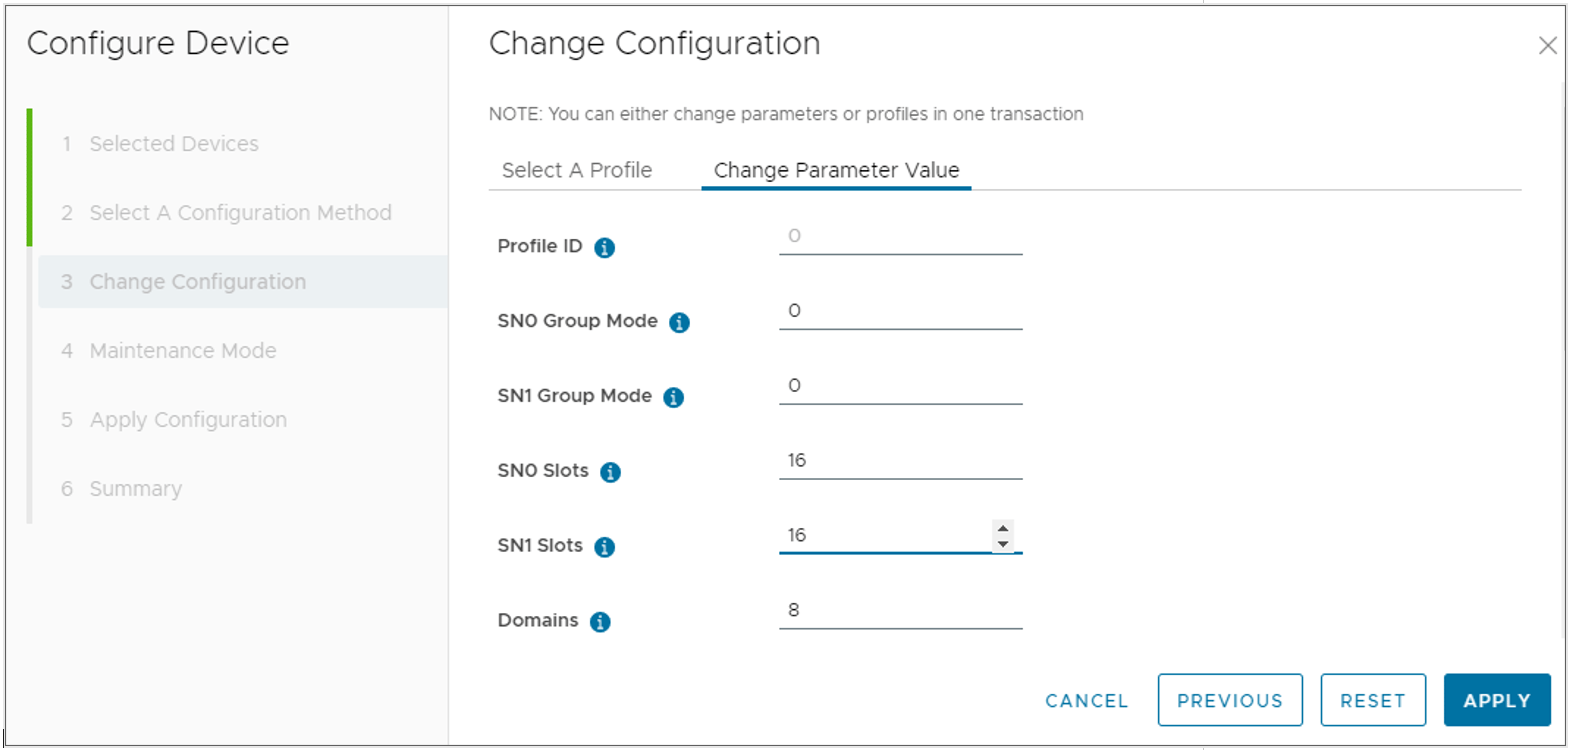
These are the configuration settings for the All Provisioned recipe.
The Data Plane Development Kit (DPDK*) consists of libraries to accelerate packet processing workloads. The DPDK test environment lets you simulate varying workloads with different producer and worker counts. Intel DLB can accelerate DPDK through efficient load balancing.
The following graph of data from the DPDK test environment illustrates the effectiveness of the recipes in distributing resources in different producer/worker scenarios. The labels indicate the number of producers and workers (for example, “8P8W” represents eight producers with eight workers).
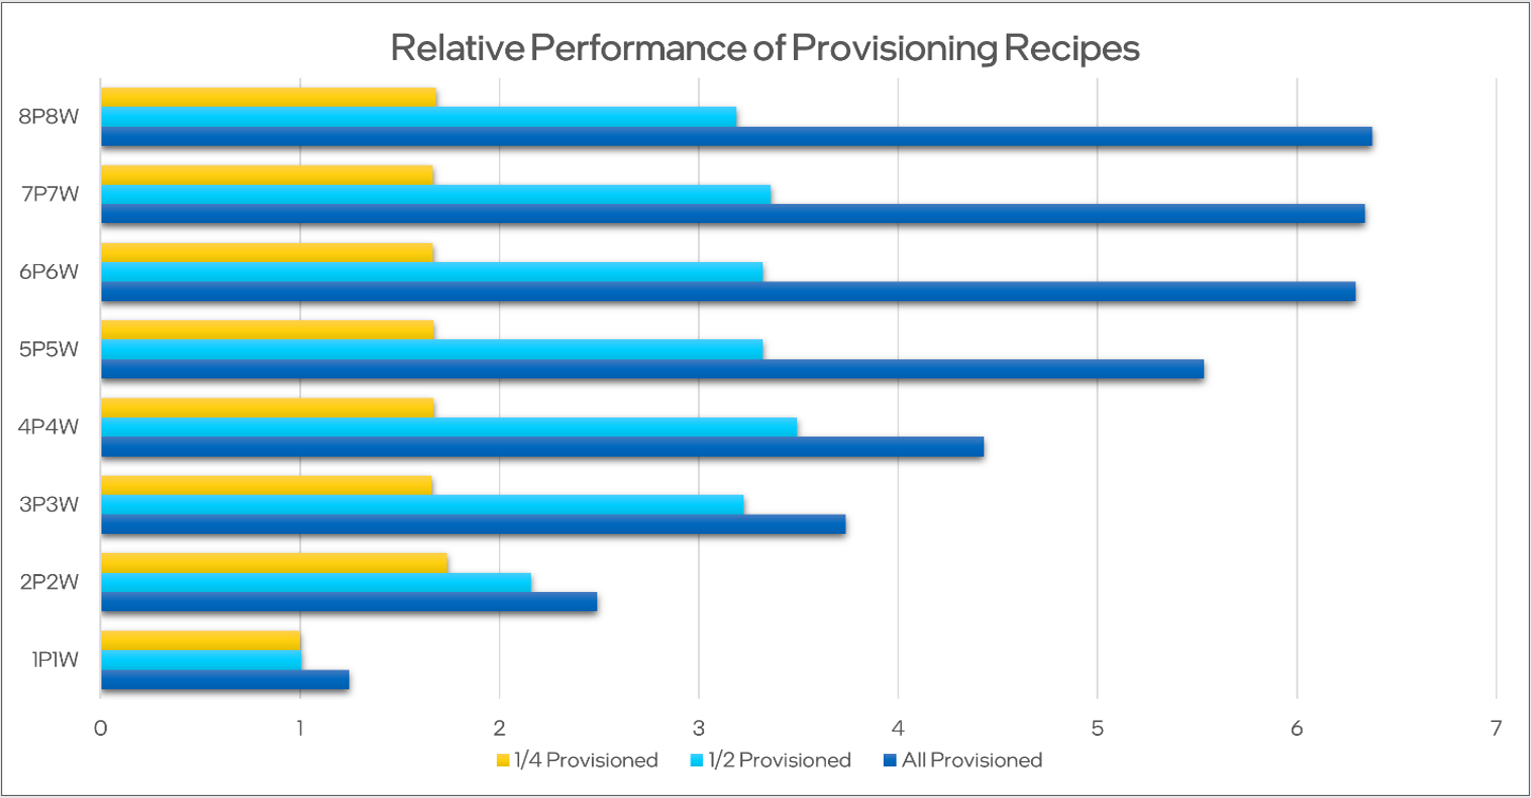
In higher producer/worker counts, the impact of other bottlenecks is reduced. Here, we notice that in these scenarios, there is near-linear scaling of performance based on how much of the resources are allocated per virtual function. This allows the system admin to adjust their settings accordingly to extract the maximum performance based on how many virtual machines are sharing the device.
These recipes can also be used to ensure that each virtual function gets only the allocated number of resources.
Intel® QuickAssist Technology
Intel QuickAssist Technology (Intel QAT) is a PCIe device that saves cycles, time, space, and cost by offloading compute-intensive workloads to free up capacity and handling data efficiently while in process, in motion, or at rest. Intel QAT specifically provides more computational resources for cryptography and data compression workloads.
Intel QAT resources are shared concurrently across all virtual functions (VFs) by default. However, Intel QAT allows enabling rate limiting through the plug-in. Rate limiting allows the Intel QAT device to split resources evenly among the VFs configured through SR-IOV.
The following illustration shows a recipe to enable rate limiting.
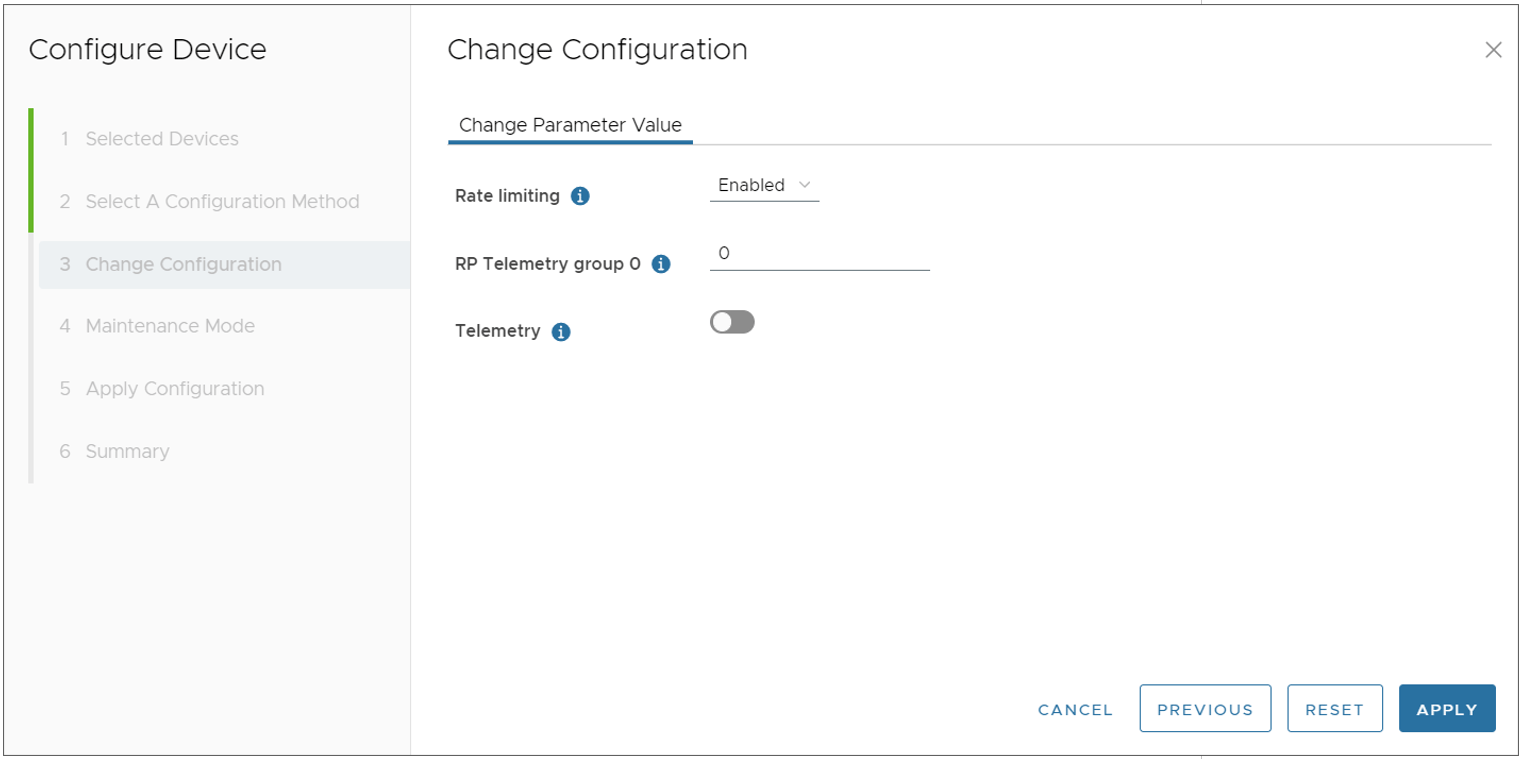
The OpenSSL* cryptography framework can use the capabilities of Intel QAT to accelerate cryptographic computations. OpenSSL is used for the implementation of Secure Sockets Layer and Transport Layer Security features in applications. The OpenSSL toolkit lets you sign and verify keys using industry standard algorithms and measure performance. No rate limiting indicates that rate limiting is disabled. The Intel QAT device is set up with 16 VFs using SR-IOV.
The following graph of DPDK test data shows the effect of rate limiting on systems with different numbers of VFs, and with no rate limiting.
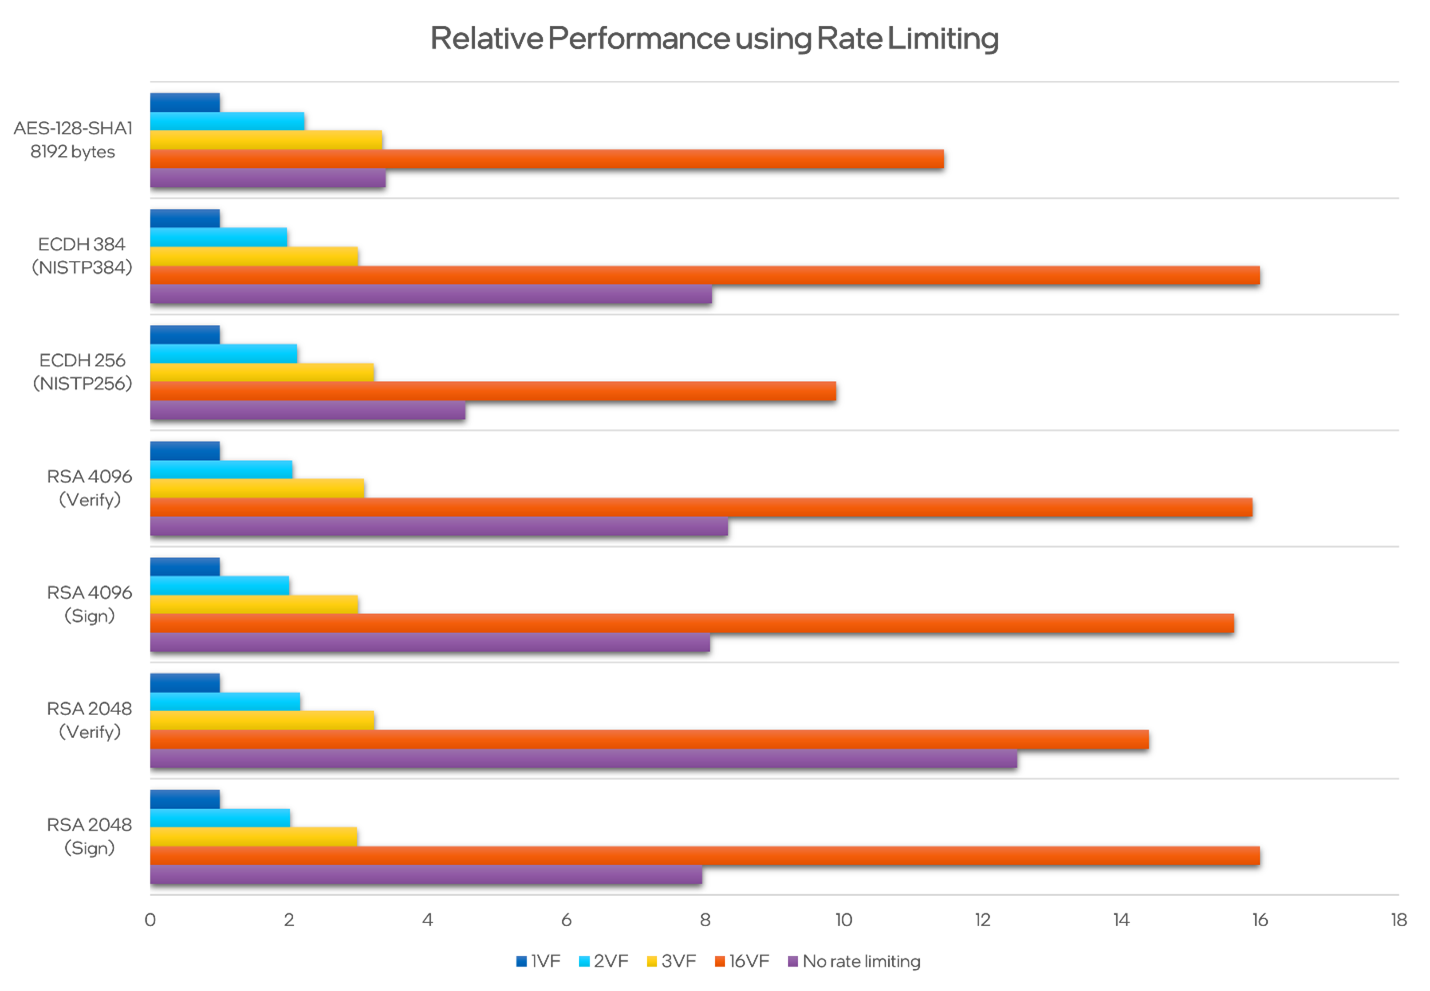
When rate limiting is enabled, the resources are evenly shared across the different VFs. This can be used to ensure that a single VF does not dominate all the resources that the Intel QAT device offers, thereby ensuring availability for all users on the system. With rate limiting and SR-IOV, the system admin can share the required amount of resources for each VM by adjusting the number of VFs allocated to each machine.
Intel® Data Center Graphics Driver for VMware ESXi*
Note Intel Device Manager for VMware vCenter plug-in requires VMware ESXi* 8.0 and VMware* vCenter Server 8.0 or later. For older versions, refer to the corresponding driver documentation regarding ESXCLI tools.
The Intel® Data Center Graphics Driver for VMware ESXi is an SR-IOV driver that enables the use of the Intel® Data Center GPU Flex Series for virtual desktops, AI, or other workloads by sharing its resources with many virtual machines running simultaneously. A primary workload is media acceleration for the VMware Horizon Virtual Desktop Infrastructure (VDI) solution in data centers and enterprise environments. Due to the scalable nature of such solutions, system administrators need to carefully tune and monitor the GPUs to maximize their processing capabilities for as many users as possible while maintaining an acceptable user experience. Although this can be done at the ESXi host level for debugging purposes, it also needs to be supported at the deployment level. Now, this is possible with the Intel Device Manager for VMware vCenter Server plug-in as well.
Like with other SR-IOV devices, the GPU resources are equally shared across all virtual functions (VFs) derived from a single system-on-a-chip (SoC), but the plug-in allows the user to select different VF profiles for each GPU in the system and monitor power and performance metrics in real-time.
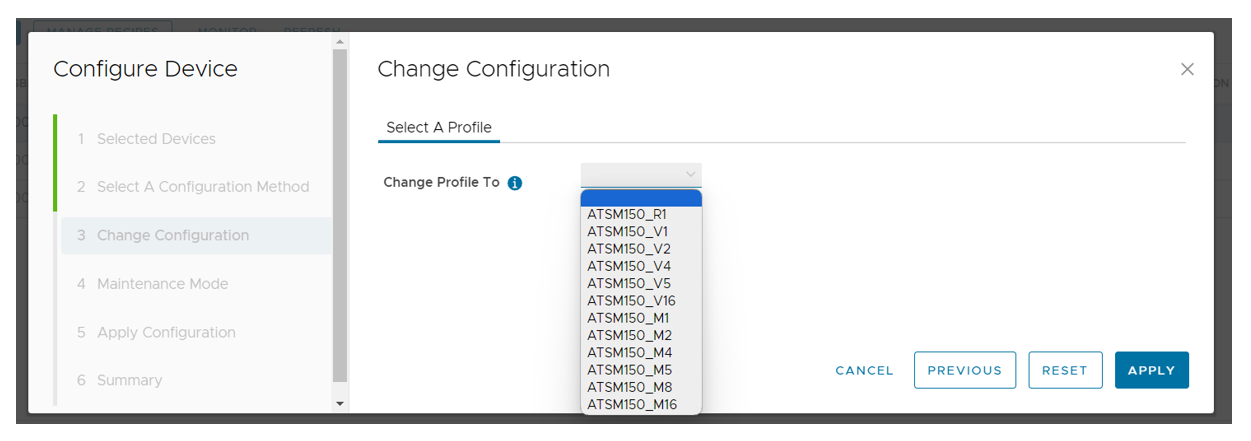
The profile name indicates the number of VFs supported. For example, a V1 profile means 1 VF is supported, and V16 or M16 means 16 VFs are supported.
An administrator can monitor GPU telemetry in real time as workloads are being run in different profiles and can have access to some historical data as well. Decisions can be based on profiles and the number of VMs running in parallel, whether to configure a GPU for a higher number of users or for higher performance.
Relative 3D Performance with a Number of Parallel VMs
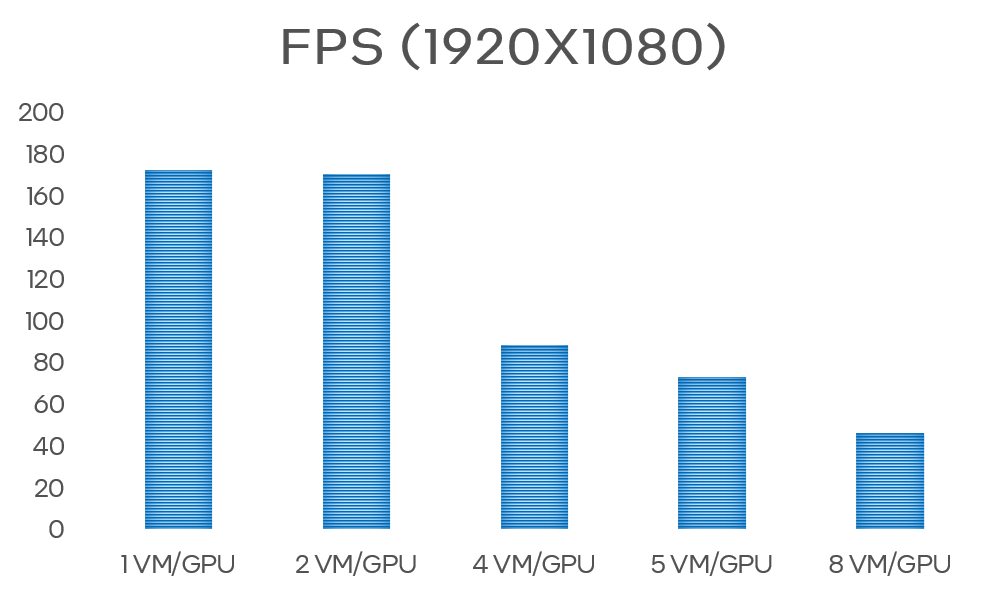
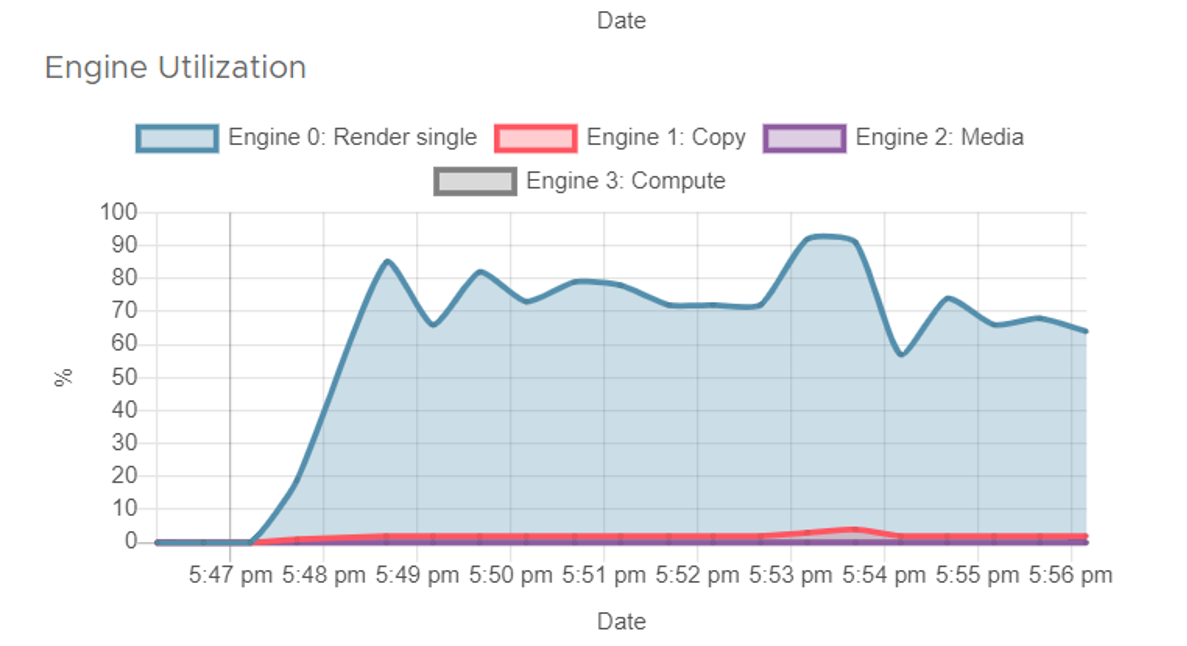
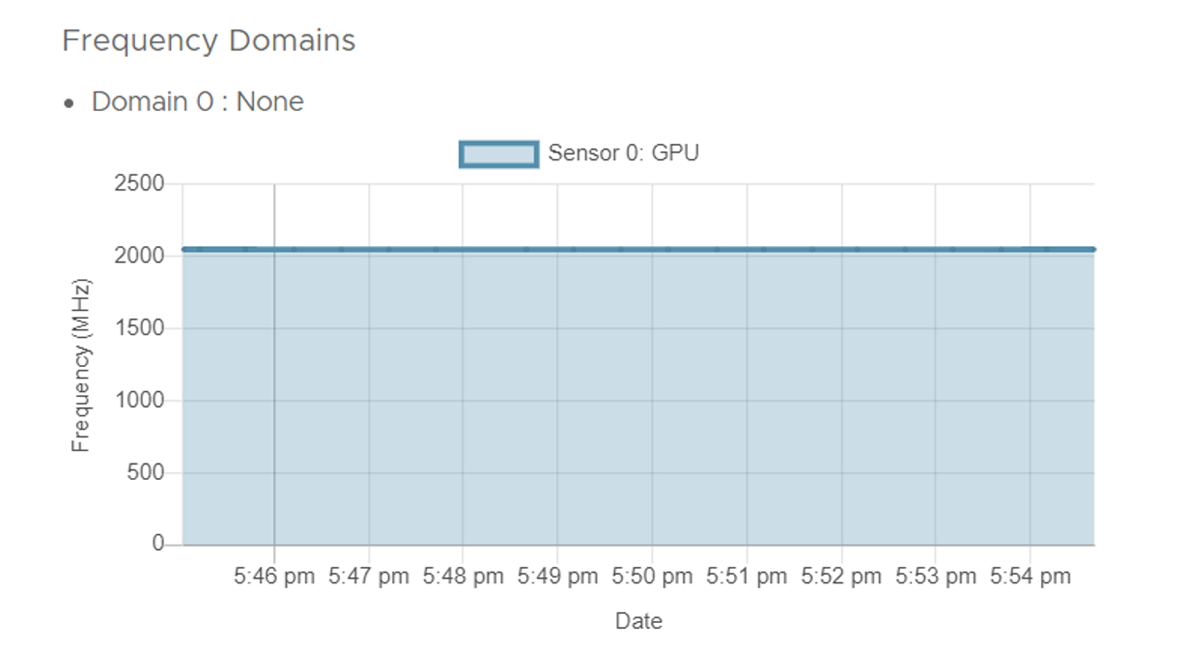
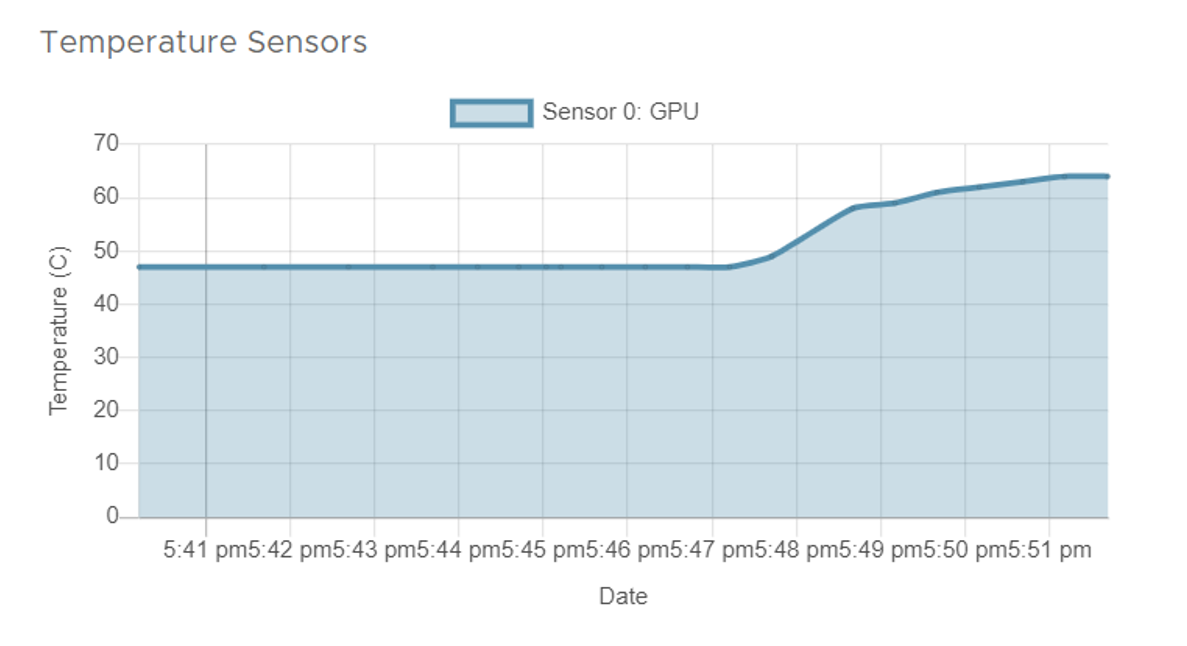
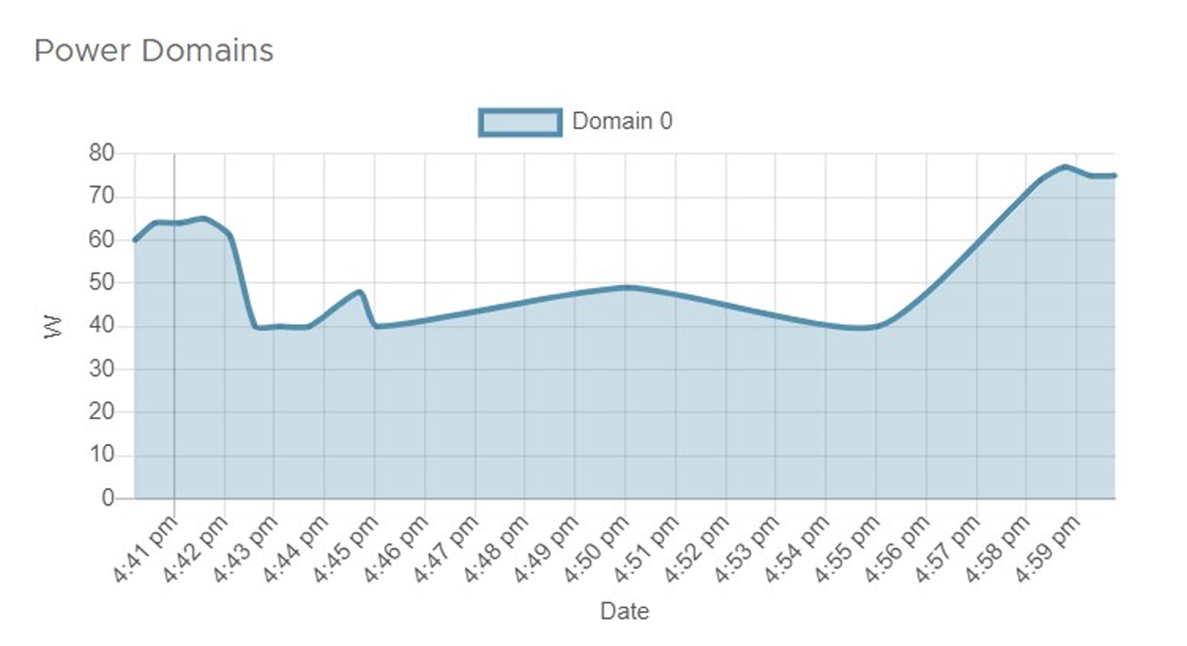
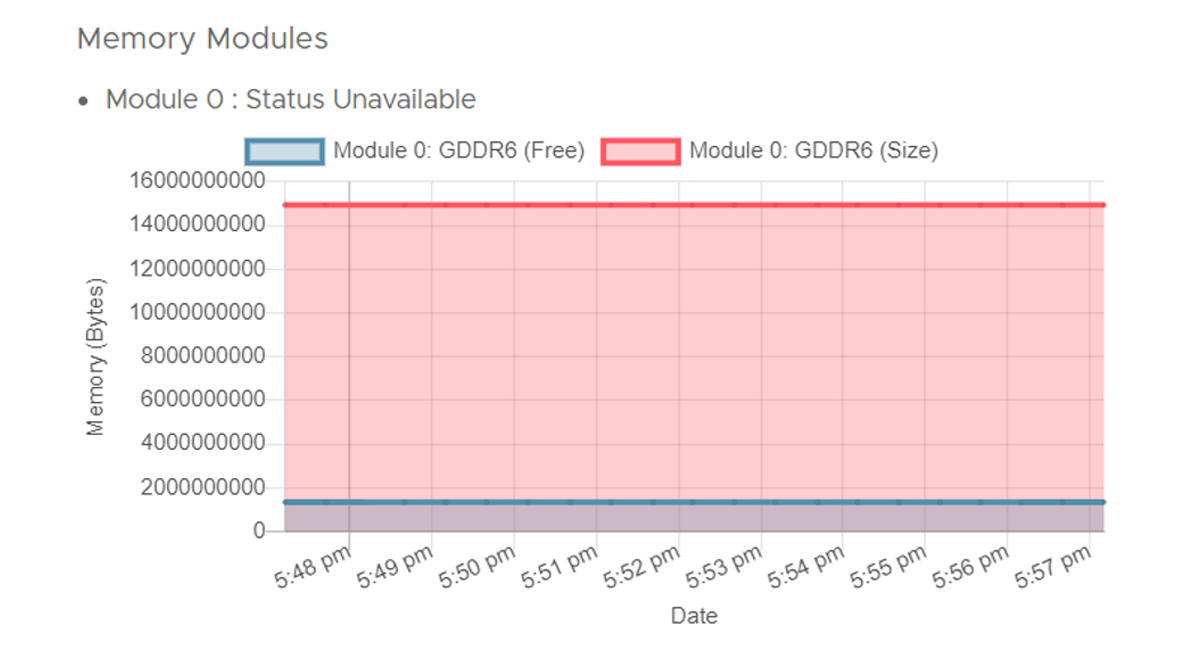
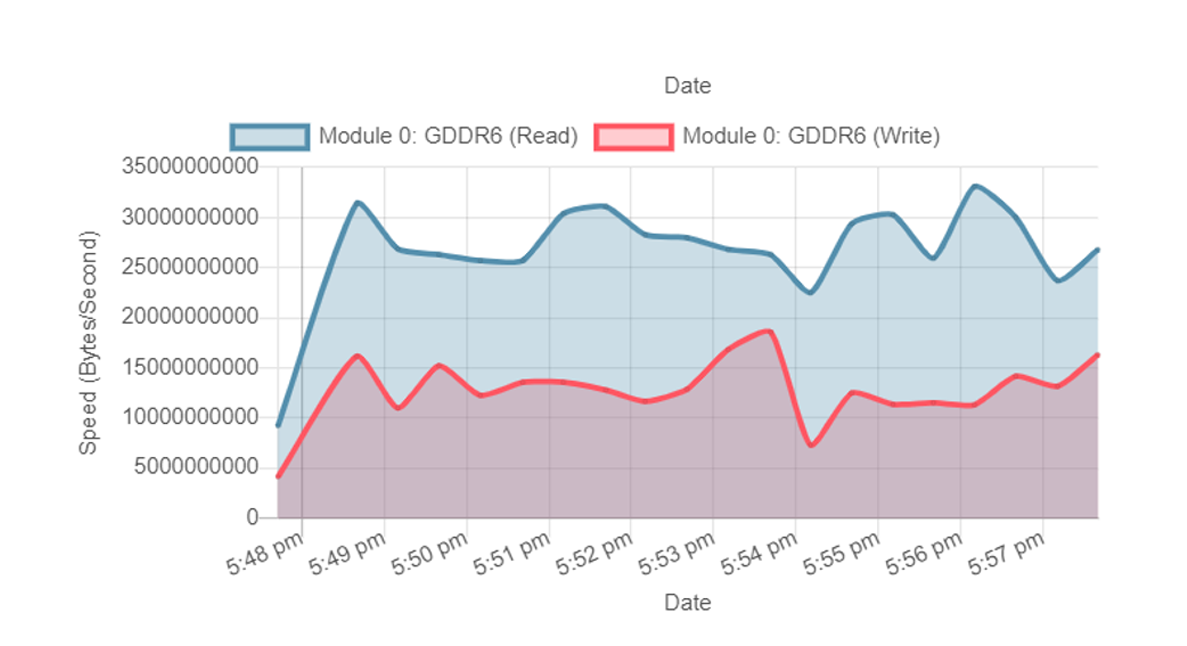
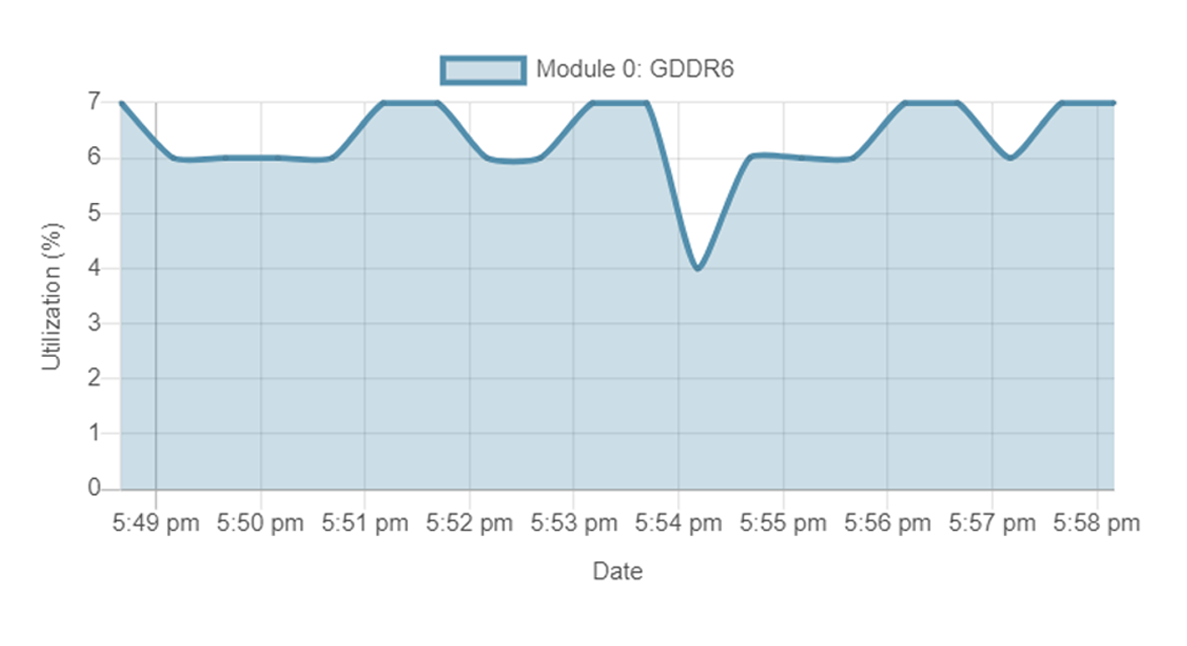
The following figures show use and sensor readings while running a 3D workload in a Windows 10® Enterprise VM in different VF profiles.
Engine Use
GPU Frequency
GPU Core Temperature
Power Domains
Memory Modules
More Resources
Intel Device Manager for VMware vCenter Server Plug-in
Intel QuickAssist Technology (Intel QAT)
Intel Dynamic Load Balancer (Intel DLB)
Intel® Data Center Graphics Driver for VMware ESXi*
Learn more about the Intel and VMware collaboration.