Getting Started
Intel® XeSS technology represents a great advancement in computer graphics. By employing deep learning to intelligently upscale images and utilizing hardware acceleration, XeSS offers a solution that significantly reduces rendering times while maintaining high image quality. It is compatible with a wide range of hardware and game engines. Its adoption is steadily increasing across numerous applications.
To further optimize the Intel XeSS integration process, we are introducing Intel® XeSS Inspector, a tool designed to simplify the validation and debugging of XeSS 2 integration in the applications. It supports XeSS Super Resolution (SR), XeSS Frame Generation (FG), and Xe Low Latency (LL). This whitepaper introduces the tool's features and provides guidance on how to start using the tool for your daily XeSS development. To download the latest release, please visit our GitHub Releases.
Feature Overview
Context View
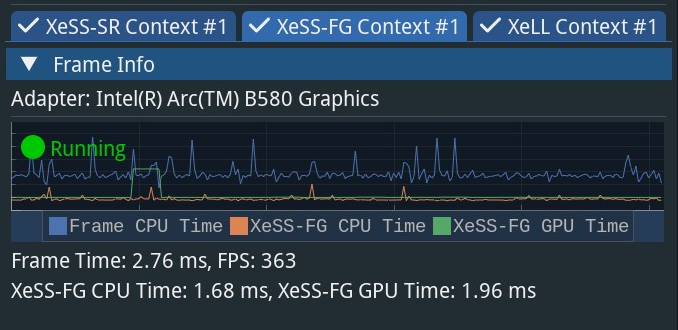
The UI shows a tab for each context. Each tab displays detailed information and support for the respective technology. A check mark on the tab button indicates the context is active and being executed.
XeSS-SR State Display
XeSS Inspector gathers and displays XeSS-SR state information, including:
- CPU frametime and FPS measured by XeSS-SR execution calls
- GPU and CPU times for XeSS-SR execution
- XeSS-SR runtime information: modules, versions, sizes, timestamps, etc.
- All initialization parameters for XeSS-SR
- All execution parameters for XeSS-SR
XeSS-FG State Display
XeSS Inspector also gathers and displays XeSS-FG state information, including:
- CPU frametime and FPS measured by XeSS-FG execution calls
- GPU and CPU times for XeSS-FG execution
- All initialization parameters for XeSS-FG
- All tagged frame resource parameters for XeSS-FG
- All tagged frame constants of XeSS-FG
XeLL State Display
XeSS Inspector also gathers and displays XeLL state information, including:
- Sleep Mode information, including whether Low Latency Mode is on or not, whether Low Latency Boost Mode is on or not, and minimum internal time (microseconds)
- Frame and latency marker data display. The frames and markers are recorded for each graphics frame and displayed on the UI under the XeLL context tab. When the user clicks "Stop and Review" or clicks on any of the rolling frames or markers, the UI will stop and allow the user to check in detail on every frame and marker. If there is any issue, the problem reason will be displayed on the UI. There are multiple failure reasons, such as:
- "Simulation-Start Must Be First After Sleep or Input Sample"
- "Incorrect Marker Order"
- "Incomplete Markers"
- "Marker Duplicated"
XeSS-SR State Overrides
XeSS Inspector allows you to perform quick experiments on the XeSS-SR context for debugging purposes without any code changes or API integration. You can override:
- Exposure scale
- Exposure multiplier (XeSS 1.3+)
- Jitter scale
- Velocity scale
- Quality level
- Initialization flags
XeSS-SR HUD Overlay
XeSS Inspector enables you to visualize XeSS-SR input buffers on the target application as overlays. You can choose different views with channels, histograms, and other controls. Different visualizations are used for different buffer types.
Frame Dump
XeSS Inspector allows you to trigger the frame dump feature. You can dump the inputs and outputs of XeSS-SR and XeSS-FG over multiple frames for offline analysis.
Usage
Prerequisites
- The target application must have an XeSS 2 technology integrated (XeSS-SR, XeSS-FG or XeLL).
- The target application must not be protected by any anti-cheating or anti-debugging measures.
Select and Start Inspection on Target Process
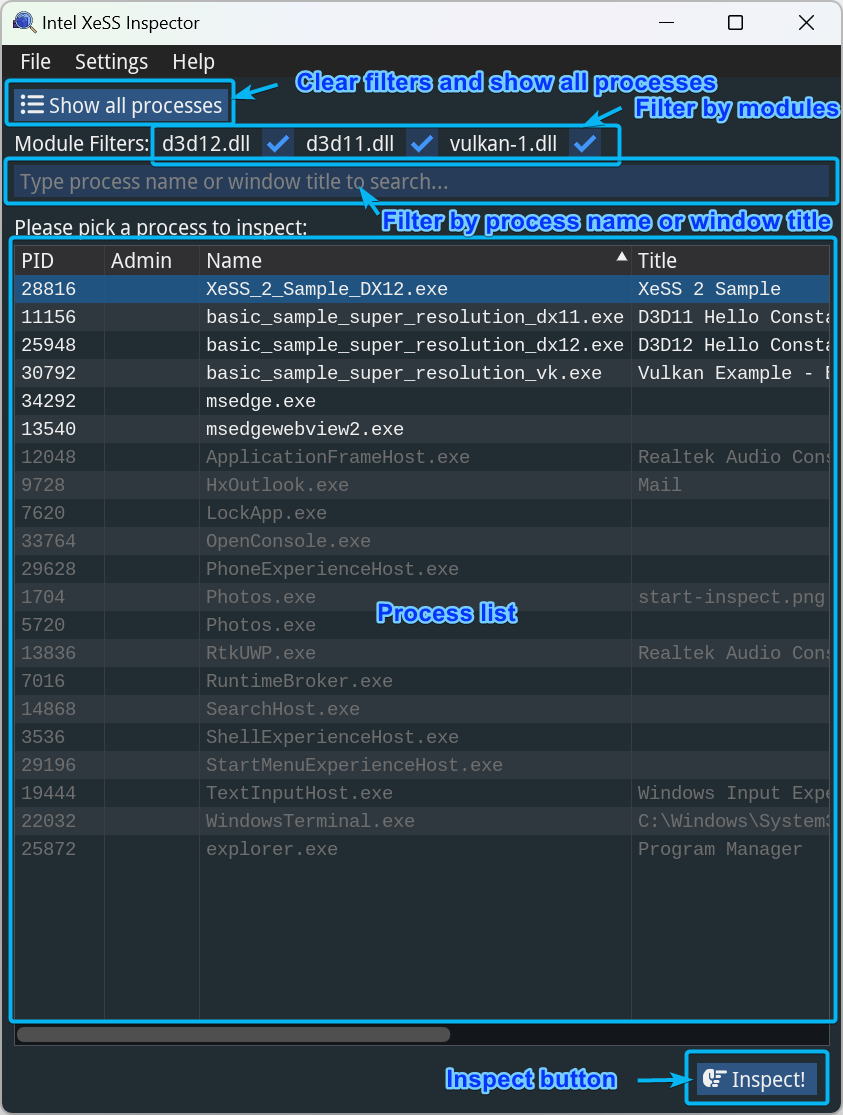
Upon launch, XeSS Inspector displays its process selection UI. You can use filters to narrow down the process or processes you're interested in. Show all processes will remove all the filters and display all the processes on your system. This is useful when you want to attach to your process before it loads any graphics modules.
After selecting the target process, click Inspect! or double-click the left mouse button to start the inspection.
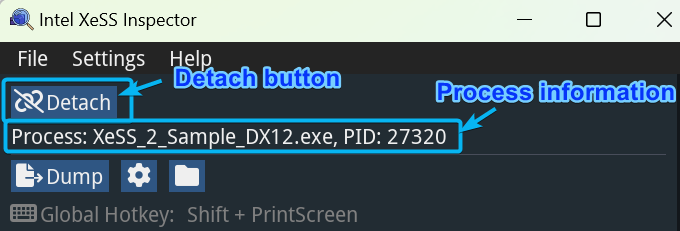
Once the process is attached, the inspection UI will appear. The process name and ID will be displayed at the top. You can cancel the inspection by clicking Detach or from the File->Detach menu. Closing the Inspector window will also cancel the current inspection. The target application will continue to run.
Dump XeSS-SR and XeSS-FG Frames
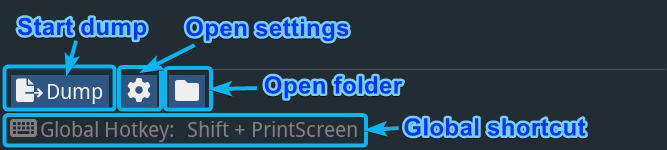
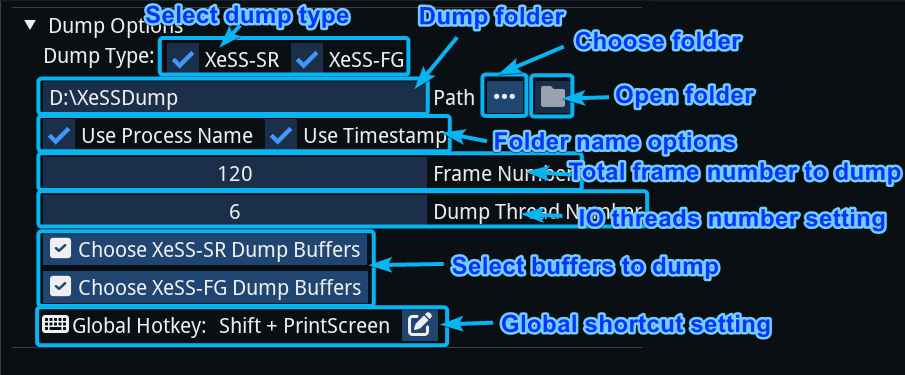
You can configure the dump settings from the Settings window by clicking the gear icon next to Dump or from the tool's menu. By default, both XeSS-SR and XeSS-FG frames will be dumped at the same time. You can uncheck them from the Dump Type options.
The default path is %USERPROFILE%\XeSSDump. You can modify this path from the dump folder options. The "Use .EXE Name" and "Use Timestamp" options assist in organizing dump results from different dumps.
You can also adjust the number of frames to dump and number of threads to spawn for IO.
You can use the default global hotkey (Shift + PrintScreen) or configure a custom one to make the dump function more accessible.
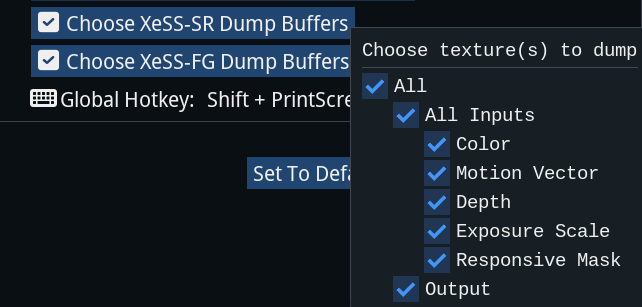
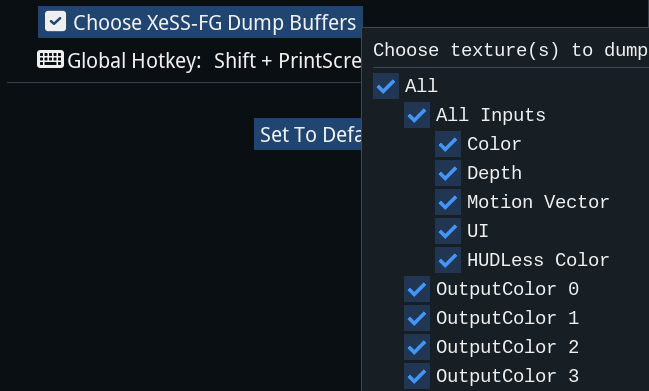
The context menus of Choose XeSS-SR Dump Buffers and Choose XeSS-FG Dump Buffers allow you to decide which texture(s) to dump:
XeSS-SR Support
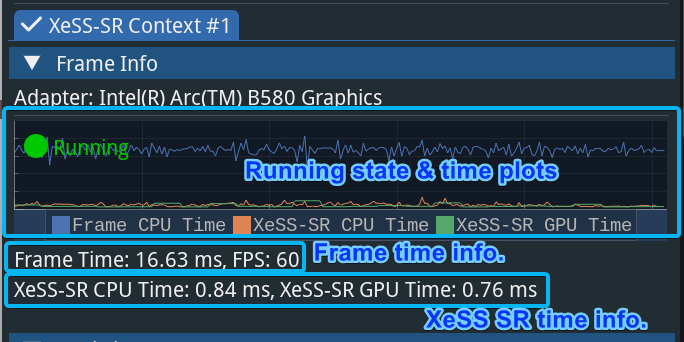
Frame Information Watch
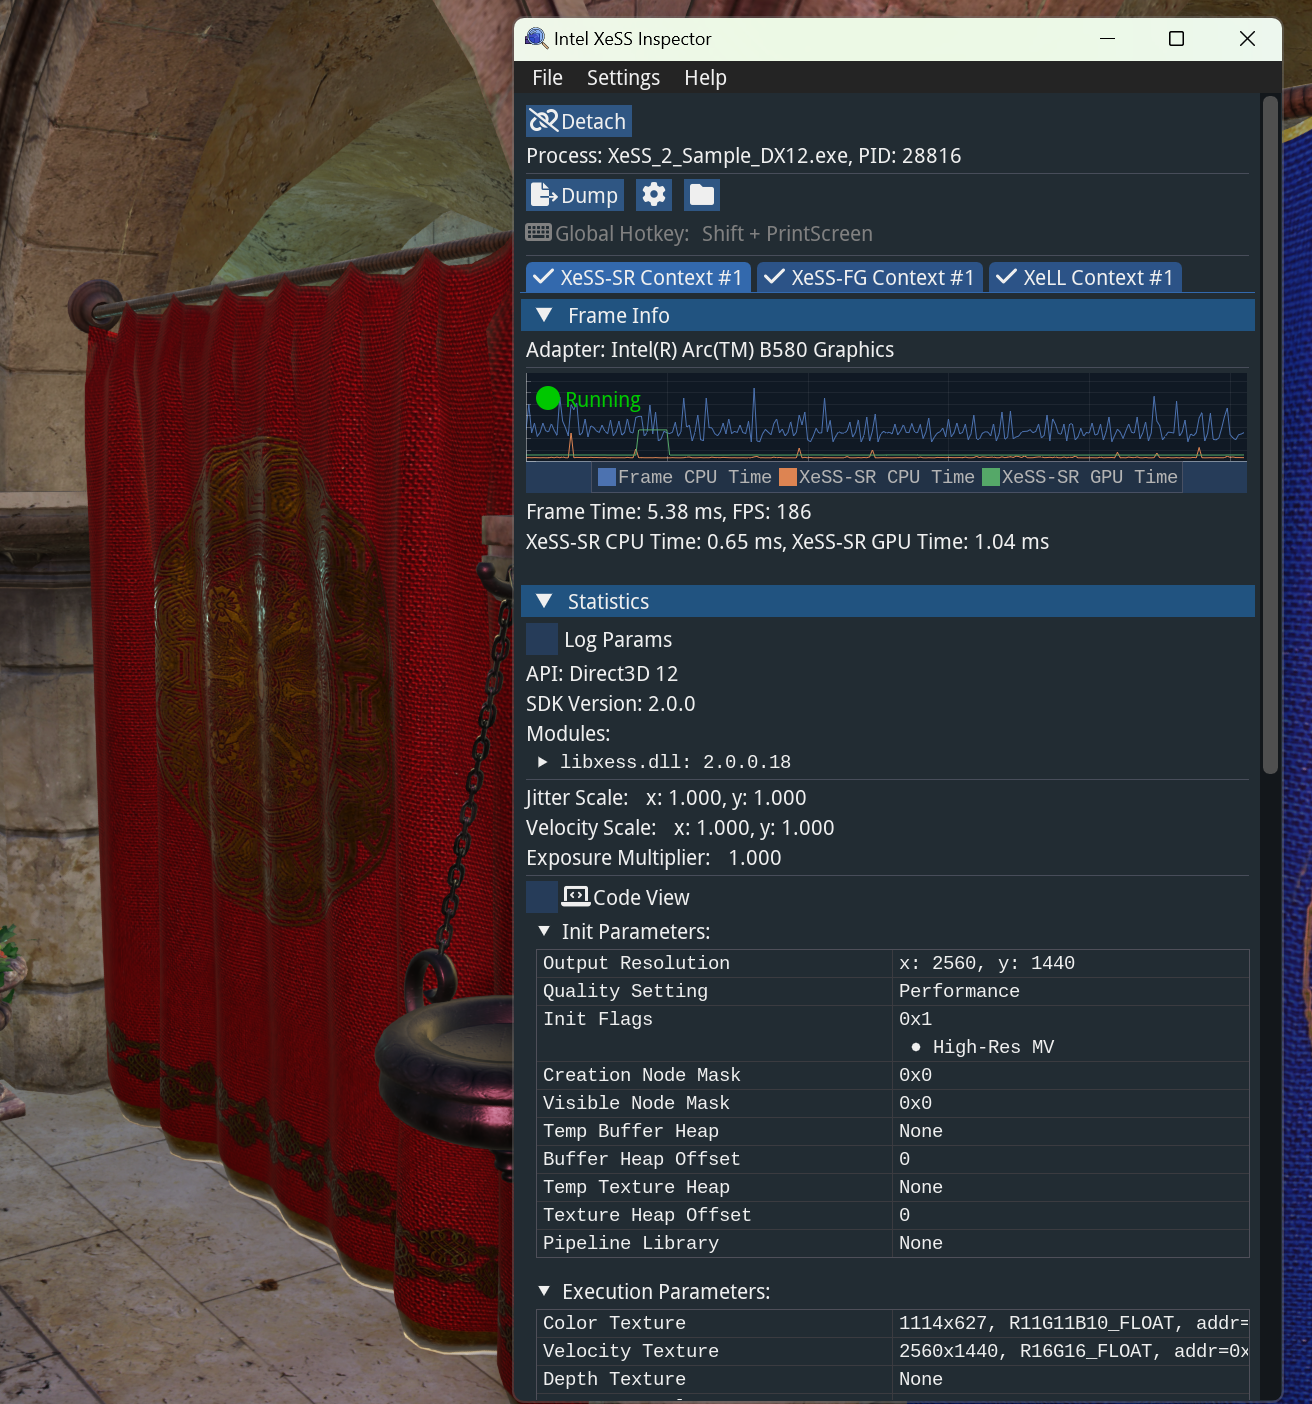
Frame Info is the first section of the XeSS-SR UI. It shows running state and time graphs, as well as frame and time data measured by XeSS-SR execution calls. If XeSS-SR is running in the application, a green Running indicator is displayed, and all graphs and data are updated in real-time.
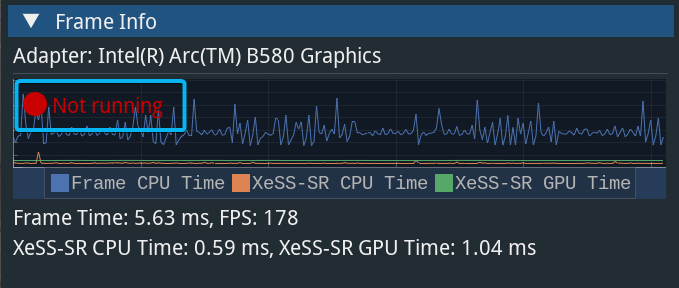
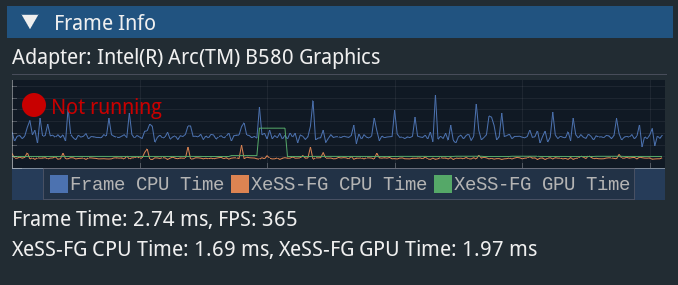
If XeSS-SR is not running, a red Not running indicator is shown, and the graph and time data of the last running frame are displayed.
Statistics Display
The Statistics section displays the XeSS-SR version and runtime information. You can view all initialization and execution parameters of the XeSS-SR context, as well as jitter and velocity scale values. This helps you quickly validate if all parameters are set correctly. Some parameters can also be logged to %USERPROFILE%\AppData\Local\Intel\XeSSInspector\xess-inspector.log if you check Log Params.
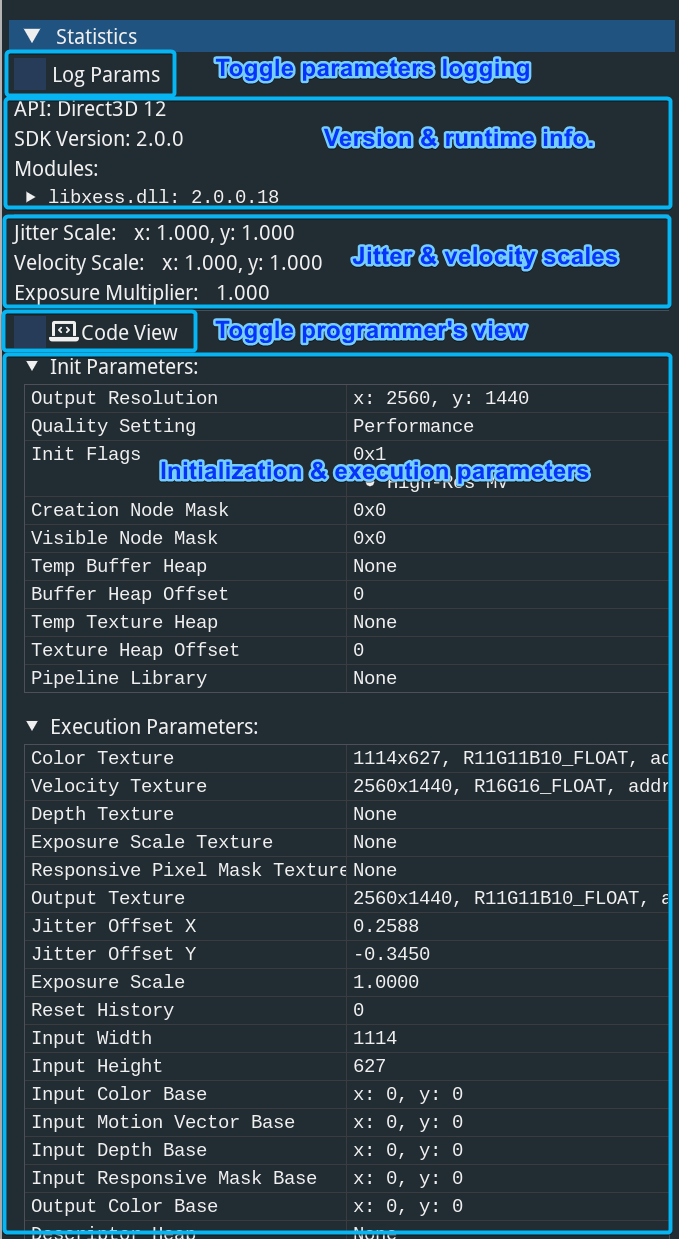
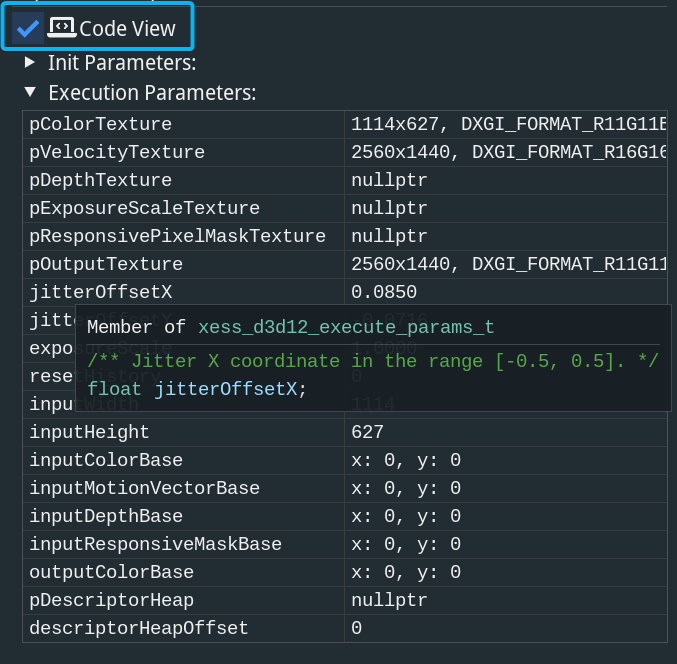
The Code View option provides a programmer's view of the parameters.
HUD Overlay for Input Buffer Visualization
In the HUD Overlay section, you can enable the Show Input Buffers checkbox and choose to display an input buffer from the current available ones. The available input buffers depend on the integration. The selected input buffer will be displayed on top of the XeSS-SR output. It's recommended to reduce post-processing in the rendering pipeline for better HUD overlay visibility. Opaque controls the opacity of the HUD overlay, while Gain amplifies the buffer values. The Histogram option is helpful for adjusting the value range.
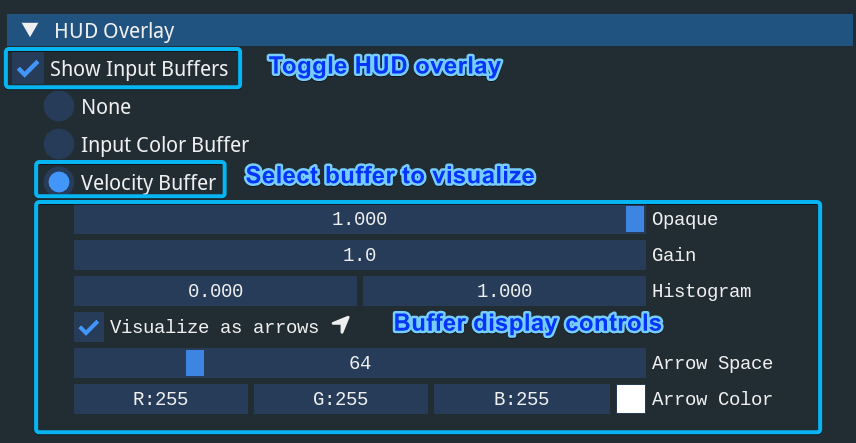
Different buffers have different controls. For example, you can choose which channel(s) to display for color buffers, while for velocity buffers, you can visualize motion vectors as arrows to check if the directions are correct.
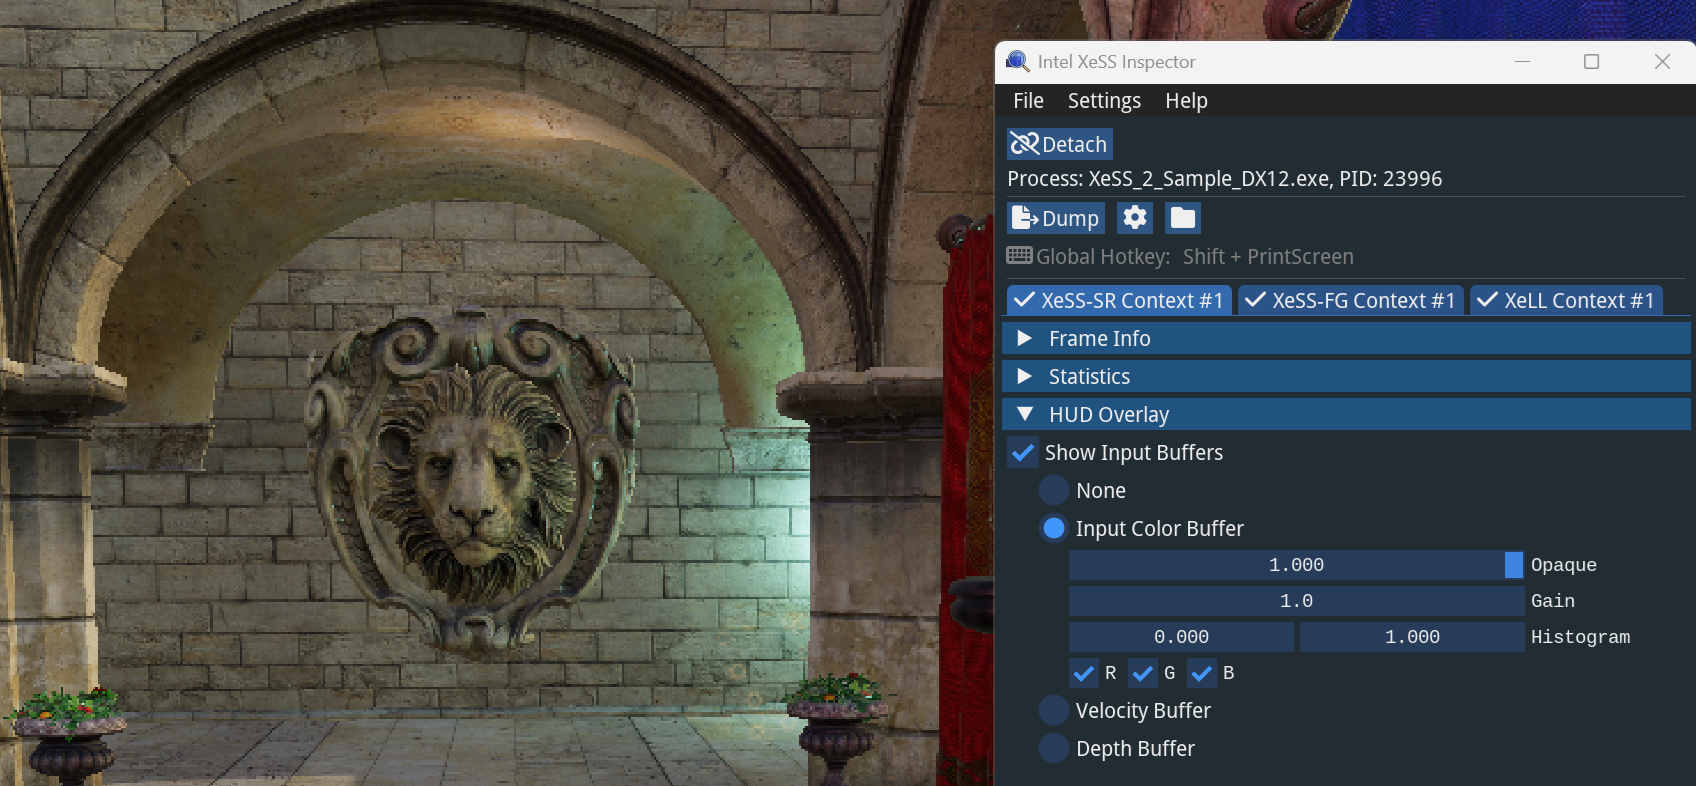
HUD overlay with input color buffer:
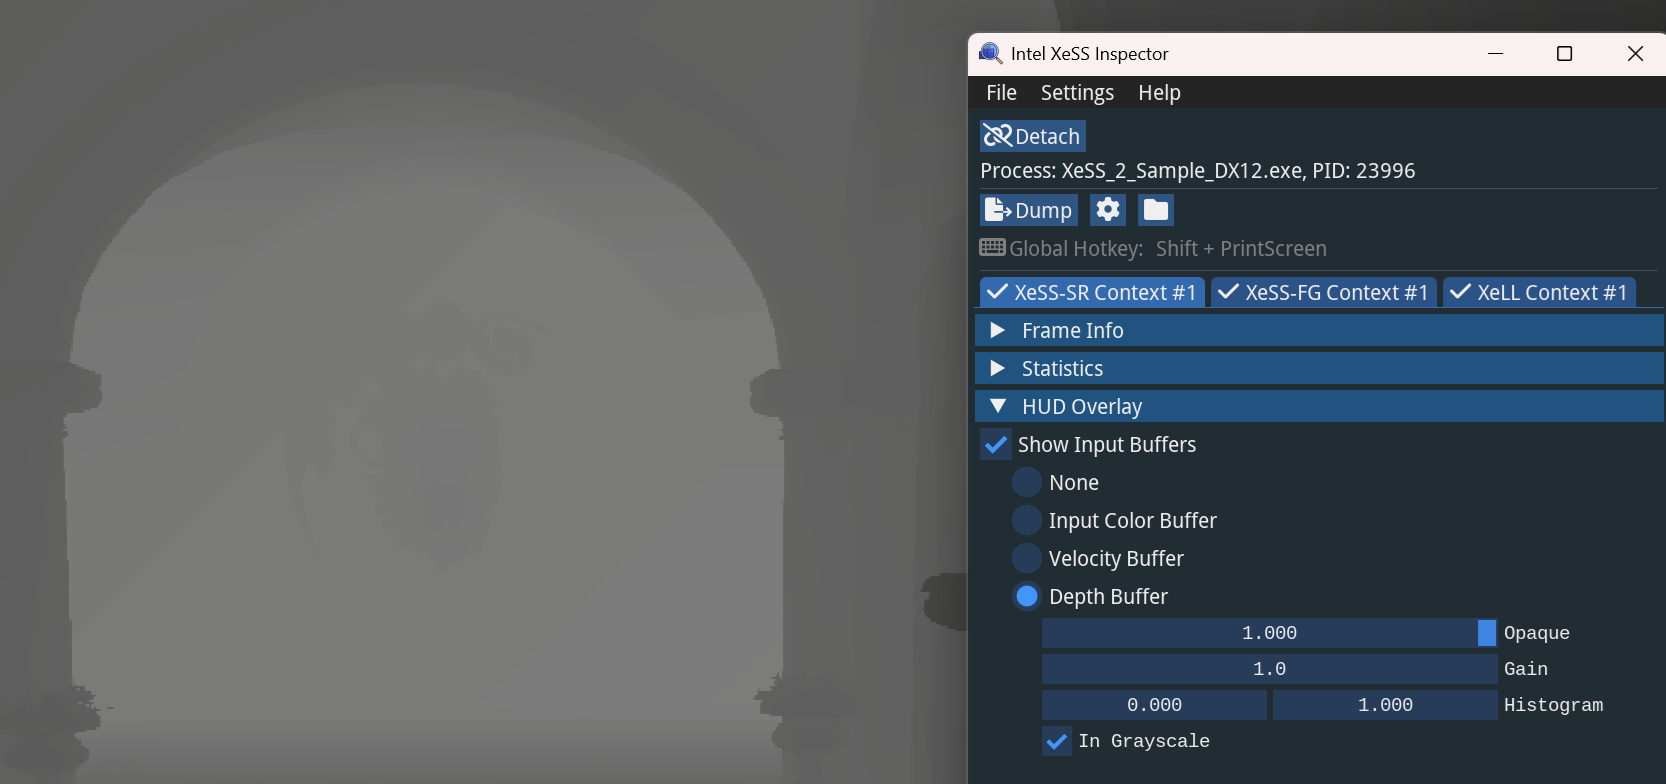
HUD overlay with depth buffer:
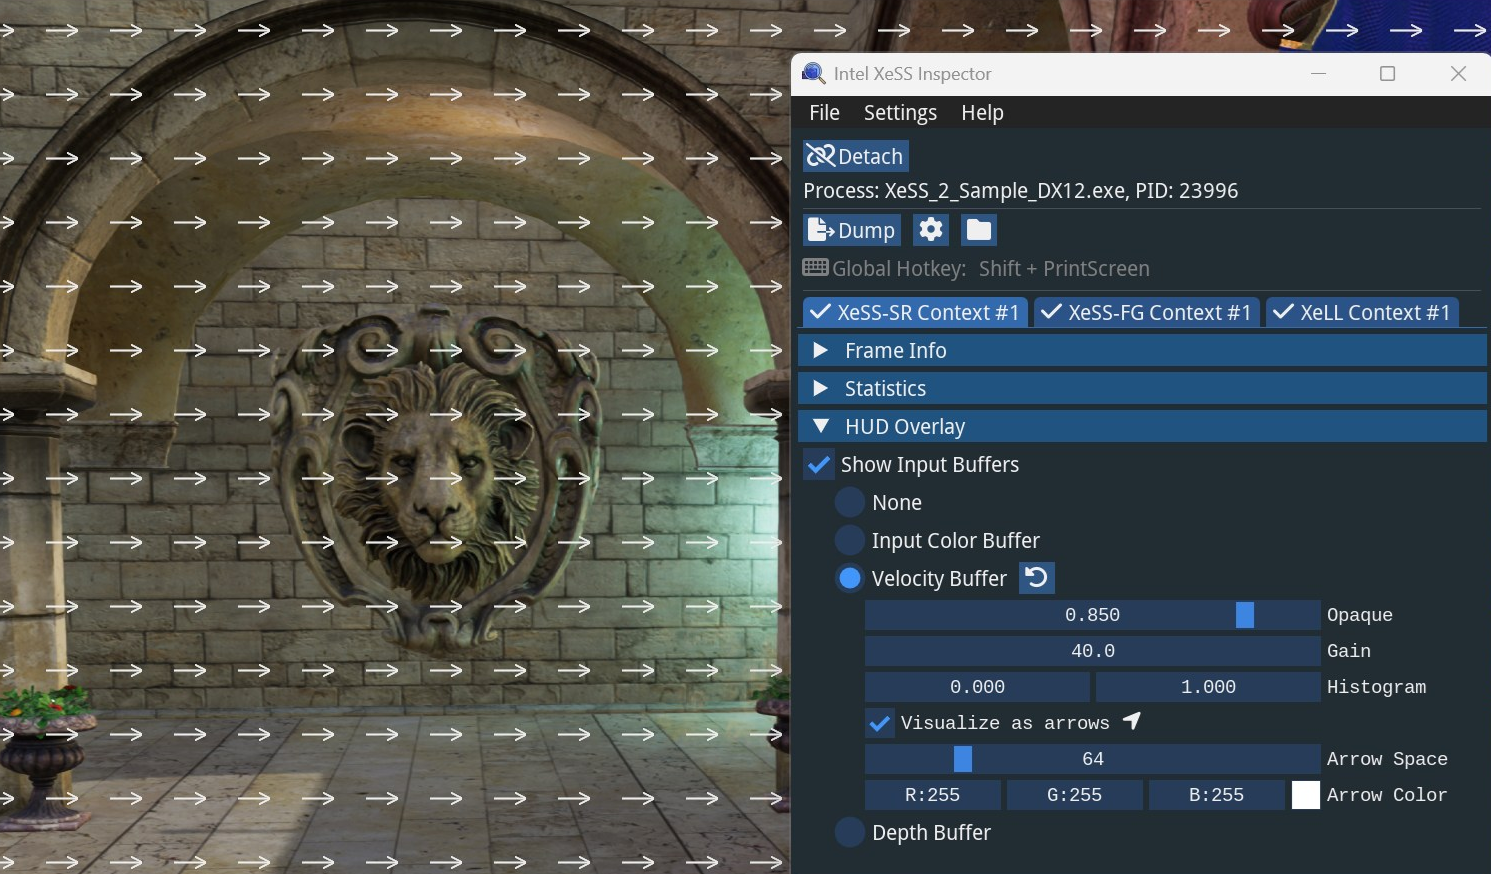
HUD overlay with velocity buffer using arrows (camera movement causes non-zero motion vector values):
Overrides for Experiments
The Overrides section allows you to perform experiments on your XeSS-SR integration without modifying the code. Here, you can quickly test various parameters, including Exposure Scale, Jitter Scale, Velocity Scale, Quality, and Init flags. Please note that all override options are tied to the current context of the technology being tested. Therefore, when applying experiments, context re-creation is not allowed.
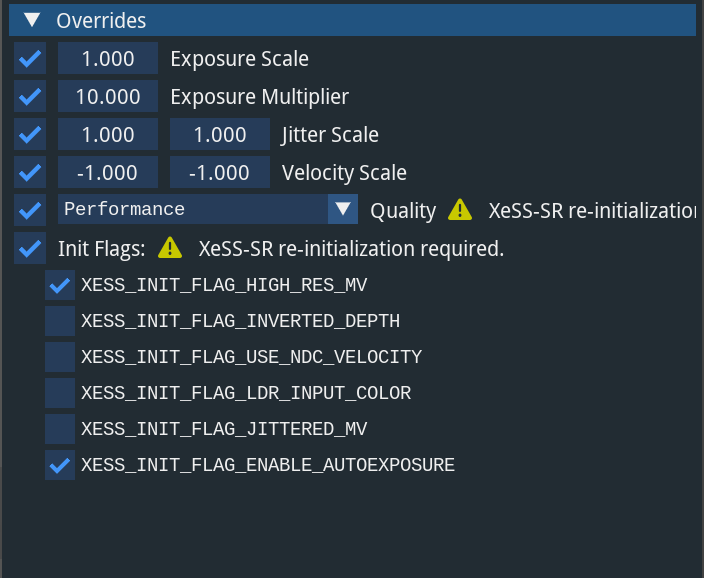
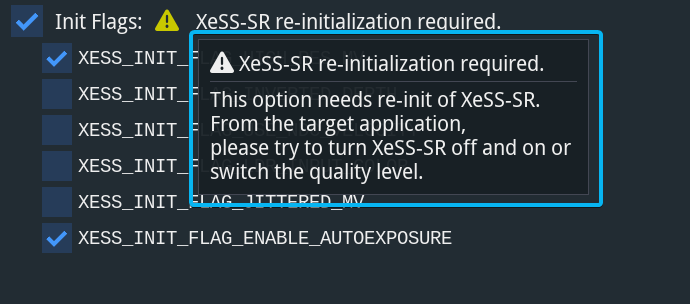
Some experiments require re-initialization from the target application, indicated by a yellow warning icon. Depending on the integration, you could select a different quality level or perform similar operations from within your application to initiate re-initialization. For a successful override, it's important to ensure that the context is not re-created throughout the process.
XeSS-FG Support
Frame Information Watch
Frame Info is the first section of the XeSS-FG UI. It shows running state and time graphs, as well as frame and time data measured by frame presentation. If XeSS-FG is running and generating frames in the application, a green Running indicator is displayed, and all graphs and data are updated in real-time.
If XeSS-FG is not running, a red Not running indicator is shown, and the graph and time data of the last running frame are displayed.
Statistics Display
The Statistics section displays the Present ID number of XeSS-FG and all the parameters including initialization parameters, resources, and constants that tagged each frame by the tagging APIs of XeSS-FG.
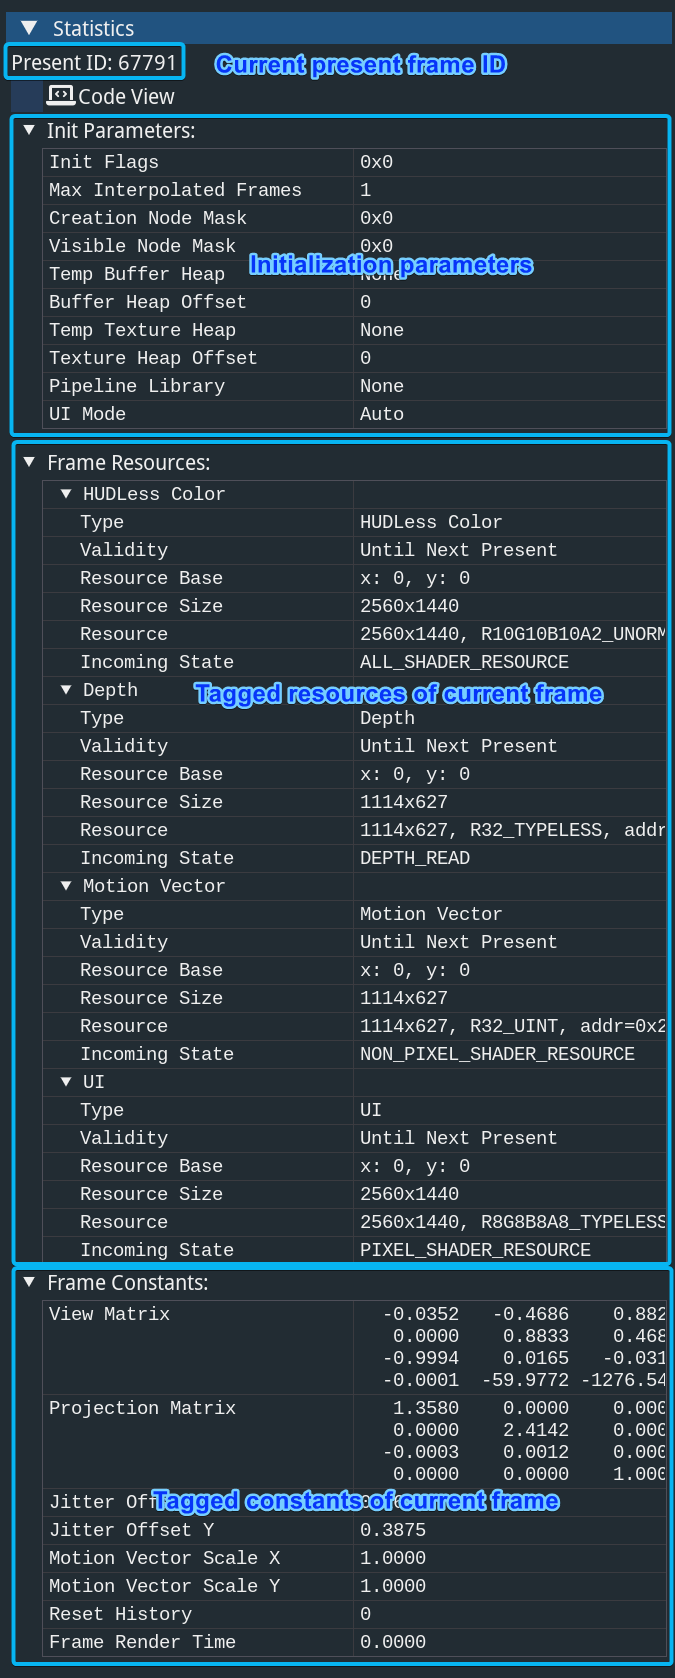
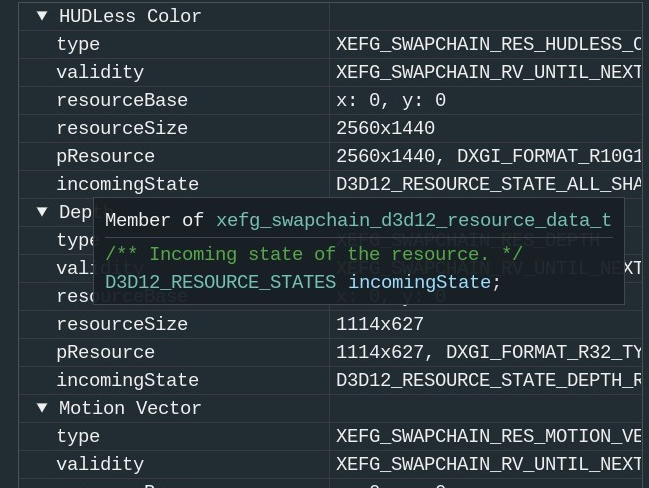
The Code View option is also available for XeSS-FG to give you a programmer's view of the parameters.
XeLL Support
General State Watch
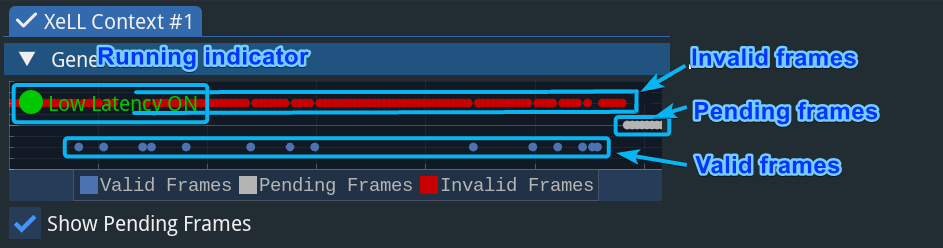
The General State is the first section of the XeLL UI. It shows running state (either Low Latency ON or Not running) and frames, as well as Sleep mode information. If XeLL is running and Low Latency Mode is on, a green Low Latency ON indicator is displayed, and all the frame dots are updated in real-time. Each dot represents one frame. If a frame is valid for the XeLL runtime, it is blue. Invalid frames are red, meaning they are not enabled by XeLL. Optionally, light grey dots can be displayed to represent pending frames that require additional subsequent frames for validity assessment.
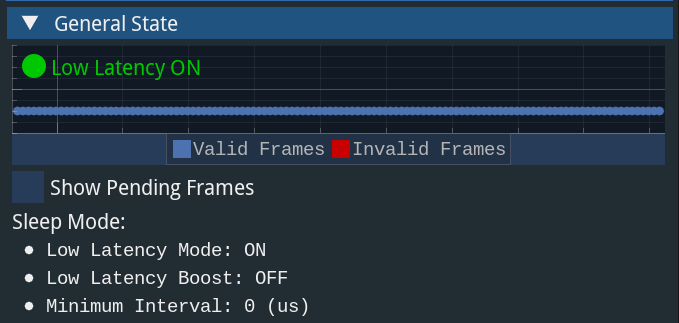
Here is an example of the General State view when every frame is valid and XeLL is taking effect. As you can see, the Low Latency Mode switch is also on.
Frame Data
XeSS Inspector captures the Sleep and Low Latency marker calls of the XeLL API and assembles them into frames. Frame number and health state are displayed. A check mark indicates that the frame is valid.
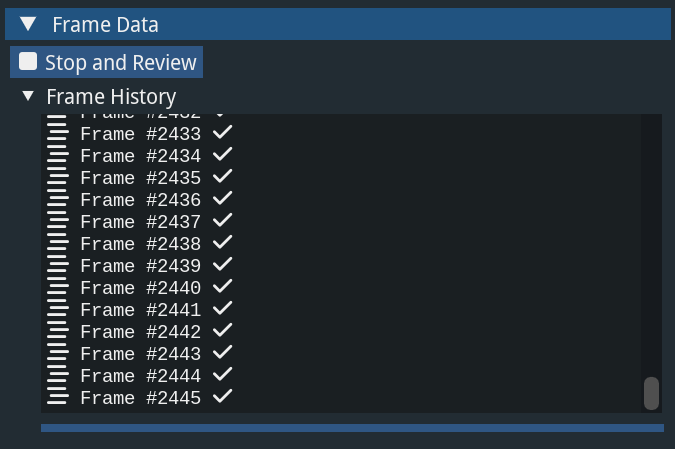
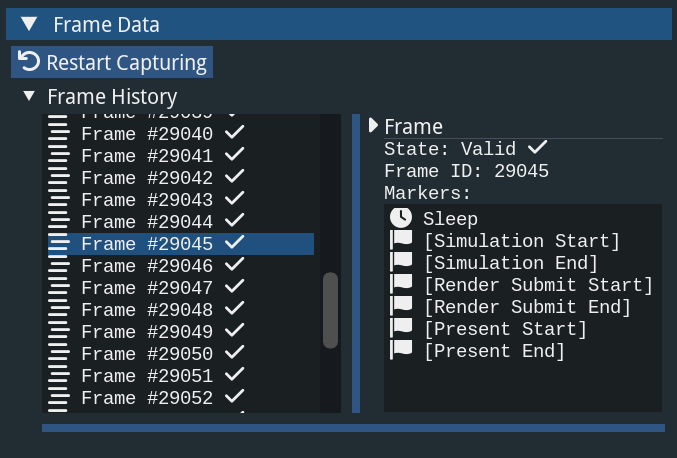
By clicking Stop and Review and the Frame History list, you can check the detailed information of each frame.
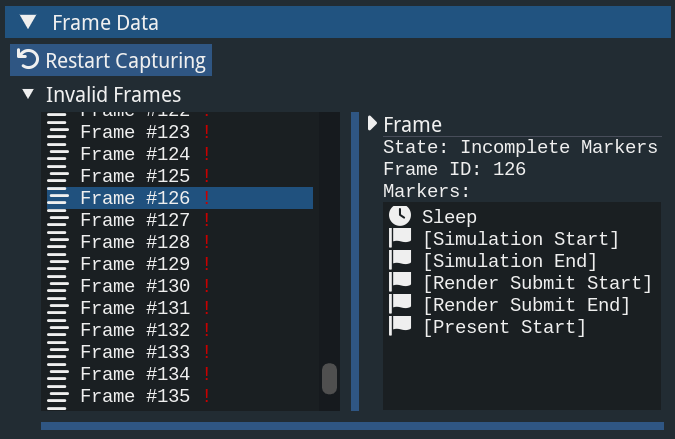
If a frame is invalid, a red exclamation mark is displayed. If you click on the frame, detailed information of this frame will be displayed, showing the reason why it is invalid.
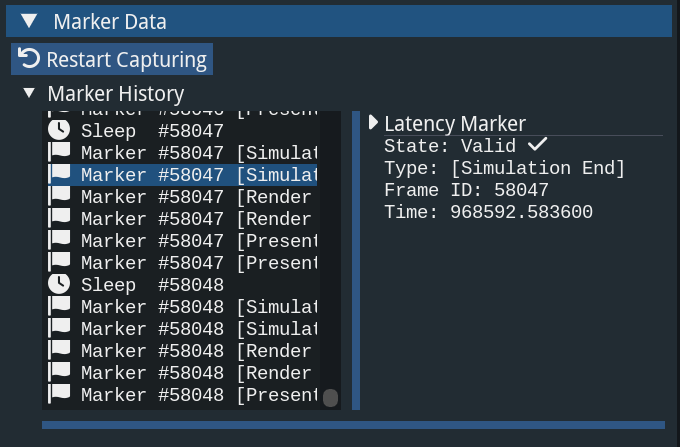
XeSS Inspector also displays all the Sleeps and Markers as raw data. You can check it in the Marker Data section.
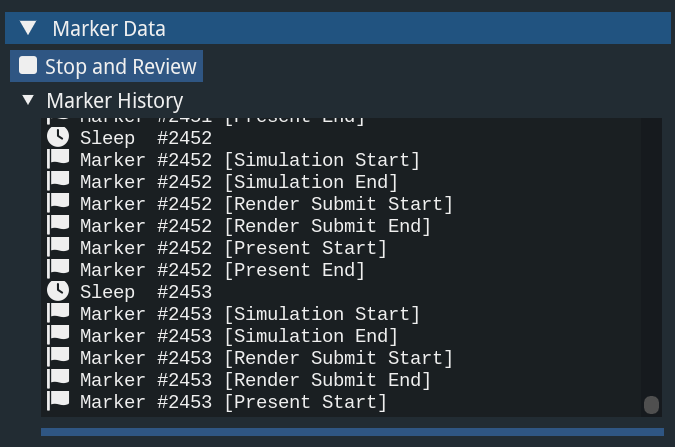
Same as the frame view, the details are also displayed if you click any of the elements in the Marker History.