Overview
When collecting industrial data generated by various types of devices and other intelligent sensors, you need a protocol gateway software to parse the different industrial protocols, including Modbus, OPC Unified Architecture (OPC UA), IEC 104, Siemens* S7 and others. Neuron*, an industrial gateway software, can parse dozens of commonly used protocols to the MQTT protocol. After parsing, industrial data is transmitted in MQTT protocol and then sent to EMQ X, an MQTT message broker. This Neuron + EMQ X data ingestion flow can be integrated with the TICK stack in Intel® Edge Insights for Industrial (Intel® EII).
Using EMQ* IoT messaging platform with Intel® EII, you can realize real-time industrial data collecting, monitoring, and processing. Coding is not required, as Neuron and EMQ X both provide Docker* images on Docker Hub.
Select Configure & Download to download Edge Insights for Industrial 4.0 with Time Series Use Case and then follow the steps below in Get Started.

Target System Requirements
Minimum System Requirements:
- 8th generation or higher Intel® Core™ processors with Intel® HD Graphics.
- 8th generation or higher Intel® Xeon® processor.
- At least 4 GB RAM.
- At least 128 GB hard drive.
- An Internet connection.
- Ubuntu* 20.04
How It Works
Edge Insights for Industrial uses the TICK stack for time-series data analytics. Telegraf*, InfluxDB* and Grafana* are parts of the TICK stack of Intel® EII. When using EMQ IoT messaging platform with Intel® EII, industrial protocol gateway software Neuron and MQTT message broker EMQ X can ingest various industrial data before Telegraf in the TICK stack.
The high-level flow of data is as follows: Modbus Simulator -> Neuron -> EMQ X -> Telegraf -> Influx -> Kapacitor* -> Influx.
- Modbus Simulator generates Modbus data.
- Neuron parses data in the Modbus protocol to data in the MQTT protocol.
- EMQ X republishes the message in the MQTT protocol in Pub/Sub mode.
- Telegraf is configured to input MQTT and subscribes data from EMQ X.
- InfluxDB is connected to Telegraf to store the data. Data can be monitored by printing out the InfluxDB logs, or by logging into Grafana to see the dashboard.
When using EMQ IoT messaging platform with Intel® EII, all the modules are running on the same node.

Get Started
Prerequisites
Select Configure & Download to download Edge Insights for Industrial 3.0 with Time Series Use Case. For requirements and installation steps, refer to the Edge Insights for Industrial Get Started Guide.
Step 1: Run Intel® EII Time Series with EMQX
- Generate EII time series deployment and configuration files:
cd [WORK_DIR]/IEdgeInsights/build
python3 builder.py -f usecases/time-series.yml
- Get docker-compose.yml with EMQ software from docker-compose.yml, and replace [WORK_DIR]/IEdgeInsights/build/docker-compose.yml with the new one.
- Download server_config.json in [WORK_DIR]/IEdgeInsights/build
- Start EII time series use case with EMQX:
cd [WORK_DIR]/IEdgeInsights/build ./docker-compose up -d -
Check if all the services are up:
docker ps
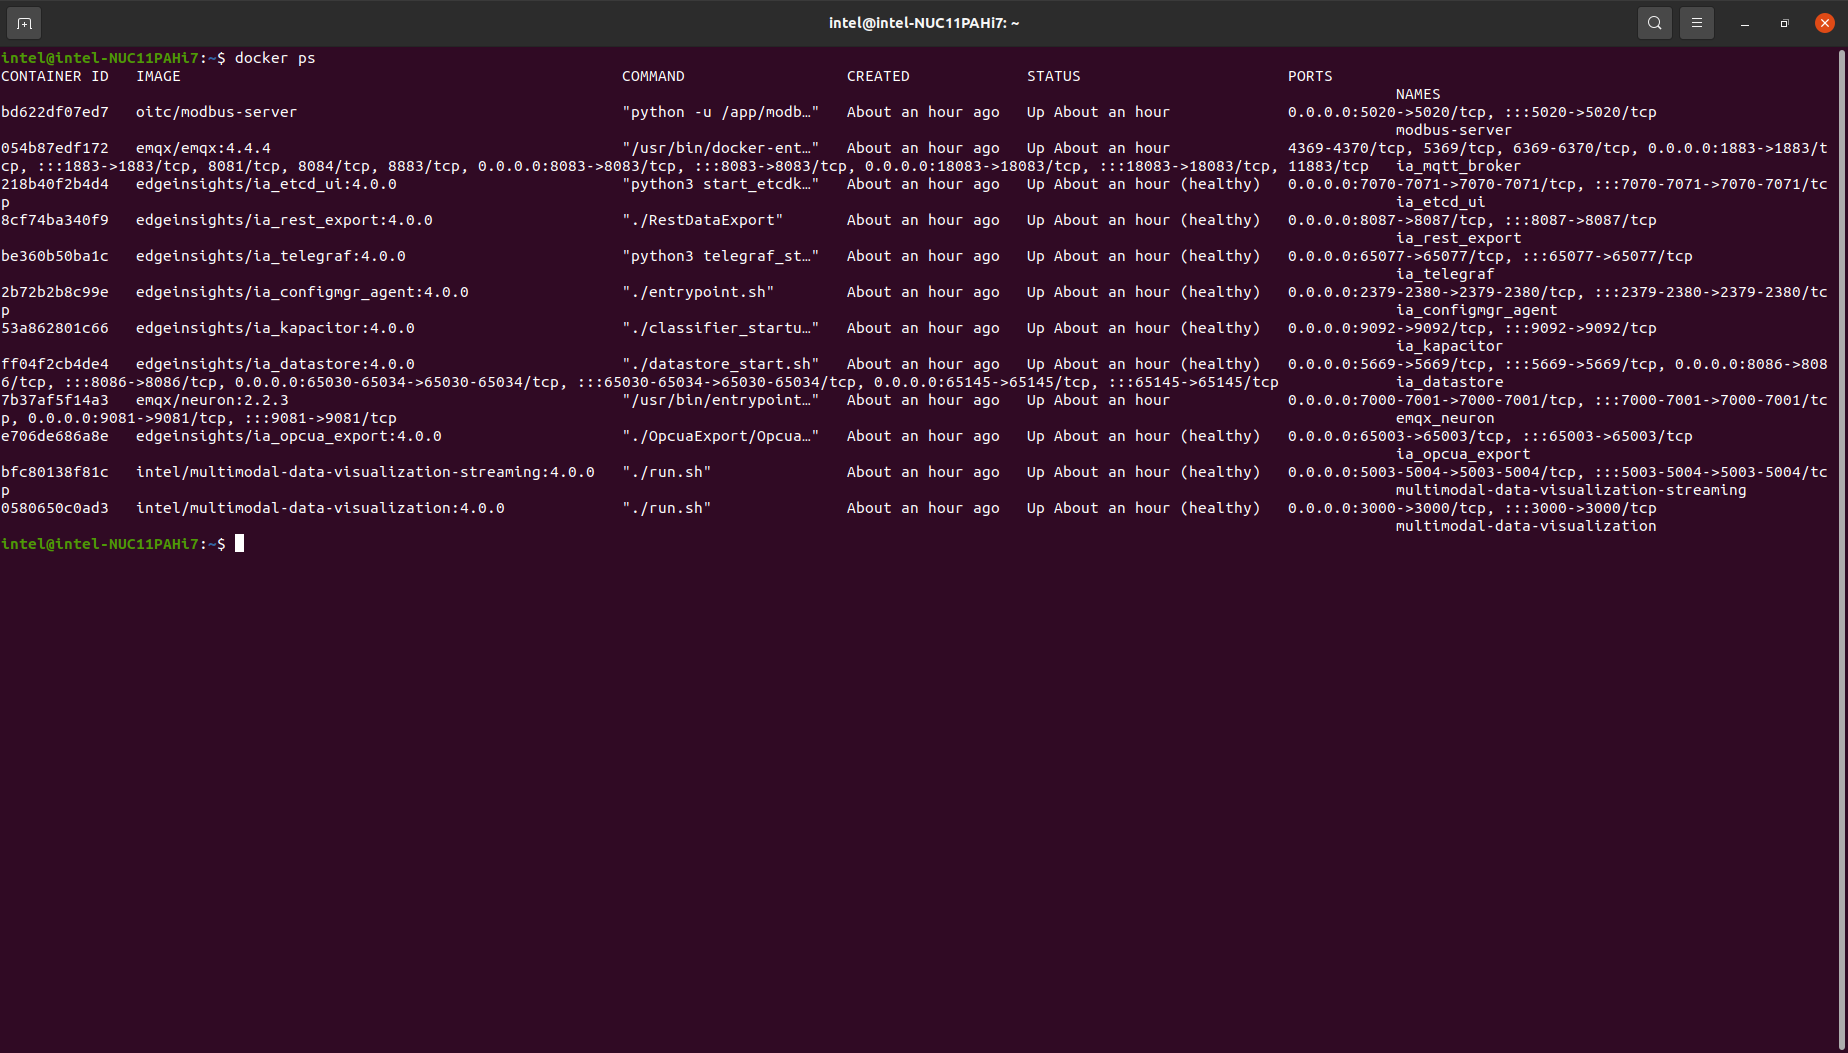
Step 2: Configure Neuron
- Open a web browser and enter NEURON_IP:7000. The username is admin and the password is 0000.
In this use case, Neuron’s IP address can be the local IP. - Add a south device named modbus_server and a modbus-tcp plugin.

Figure 2: Add South Device
- Click on Device configuration on the modbus_server tab to add configuration.

Figure 3: Configure South Device
- Click on the modbus_server tab to add a group.

Figure 4: Add South Device Group
- Click on the Tag List icon on group item to add a tag.

Figure 5: Add South Device Tag
- Add a north application named mqtt_broker.
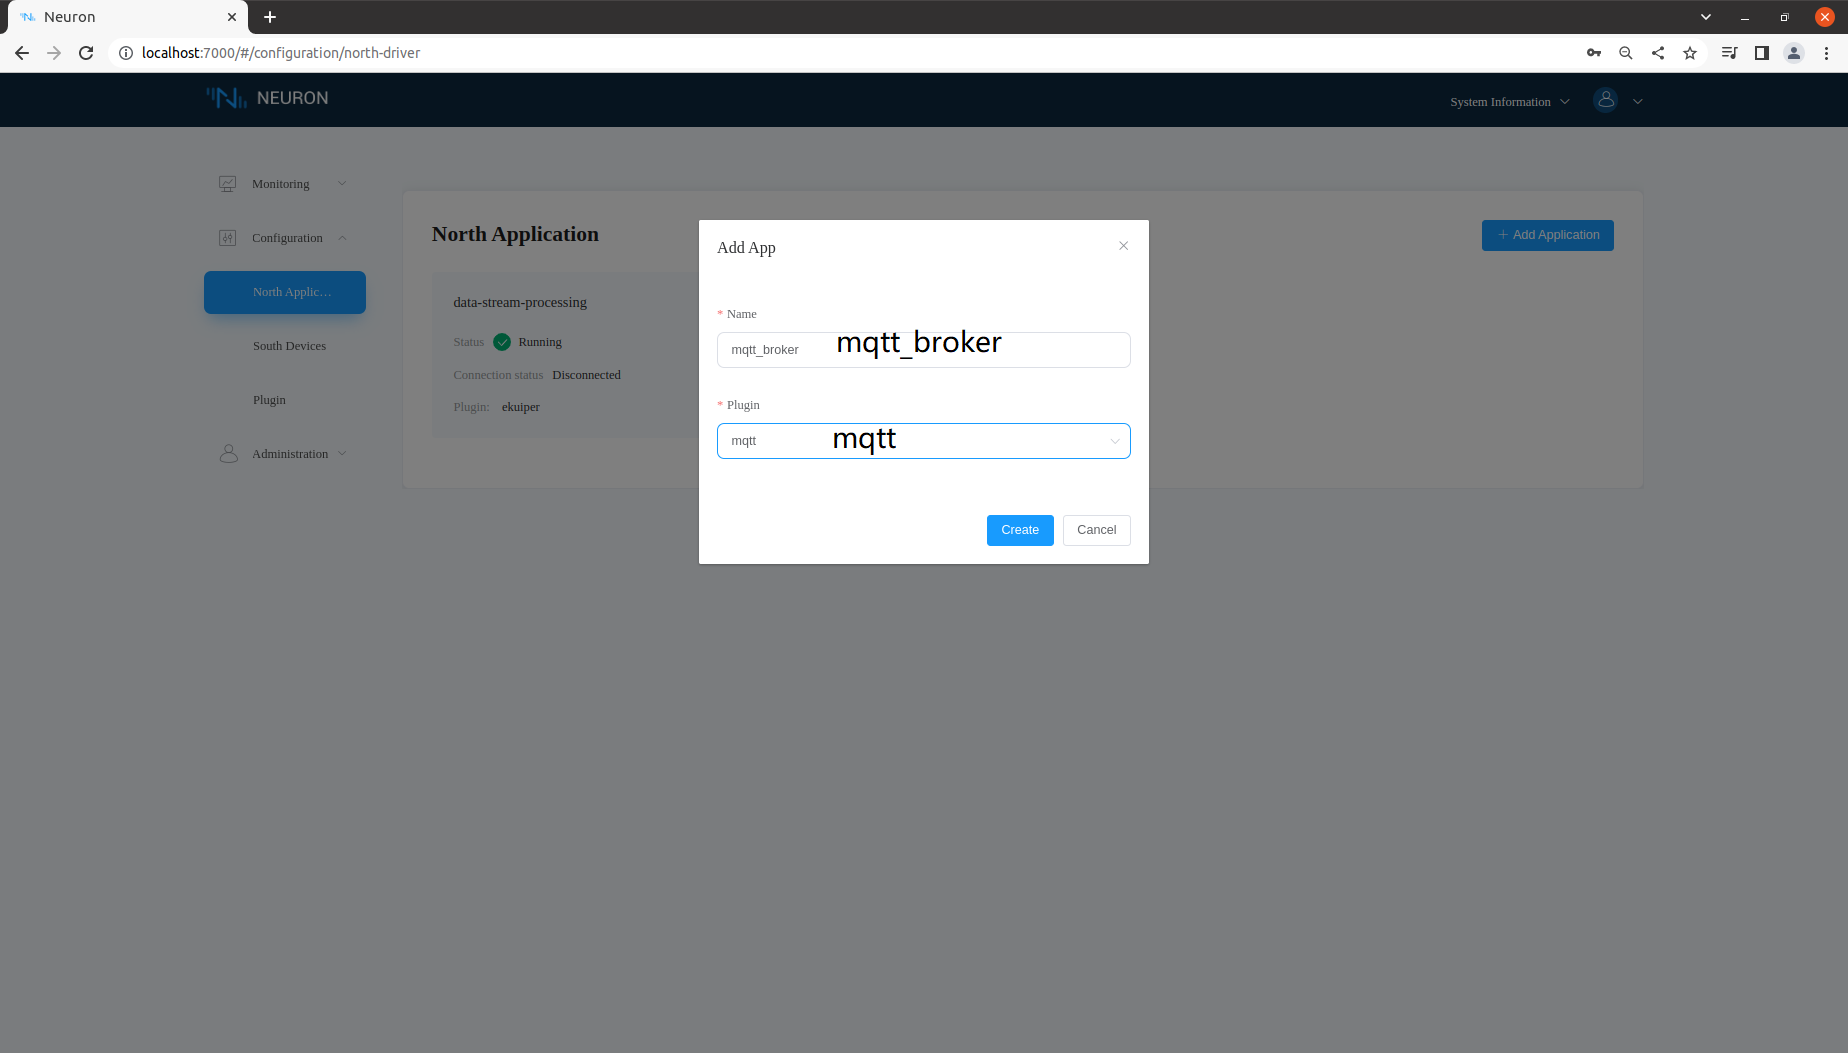
Figure 6: Add North Application
- Click on Application configuration on the mqtt_broker tab to add configuration.

Figure 7: Configure North Application
- Click on the mqtt_broker tab to add a subscription.

Figure 8: Add North Subscription
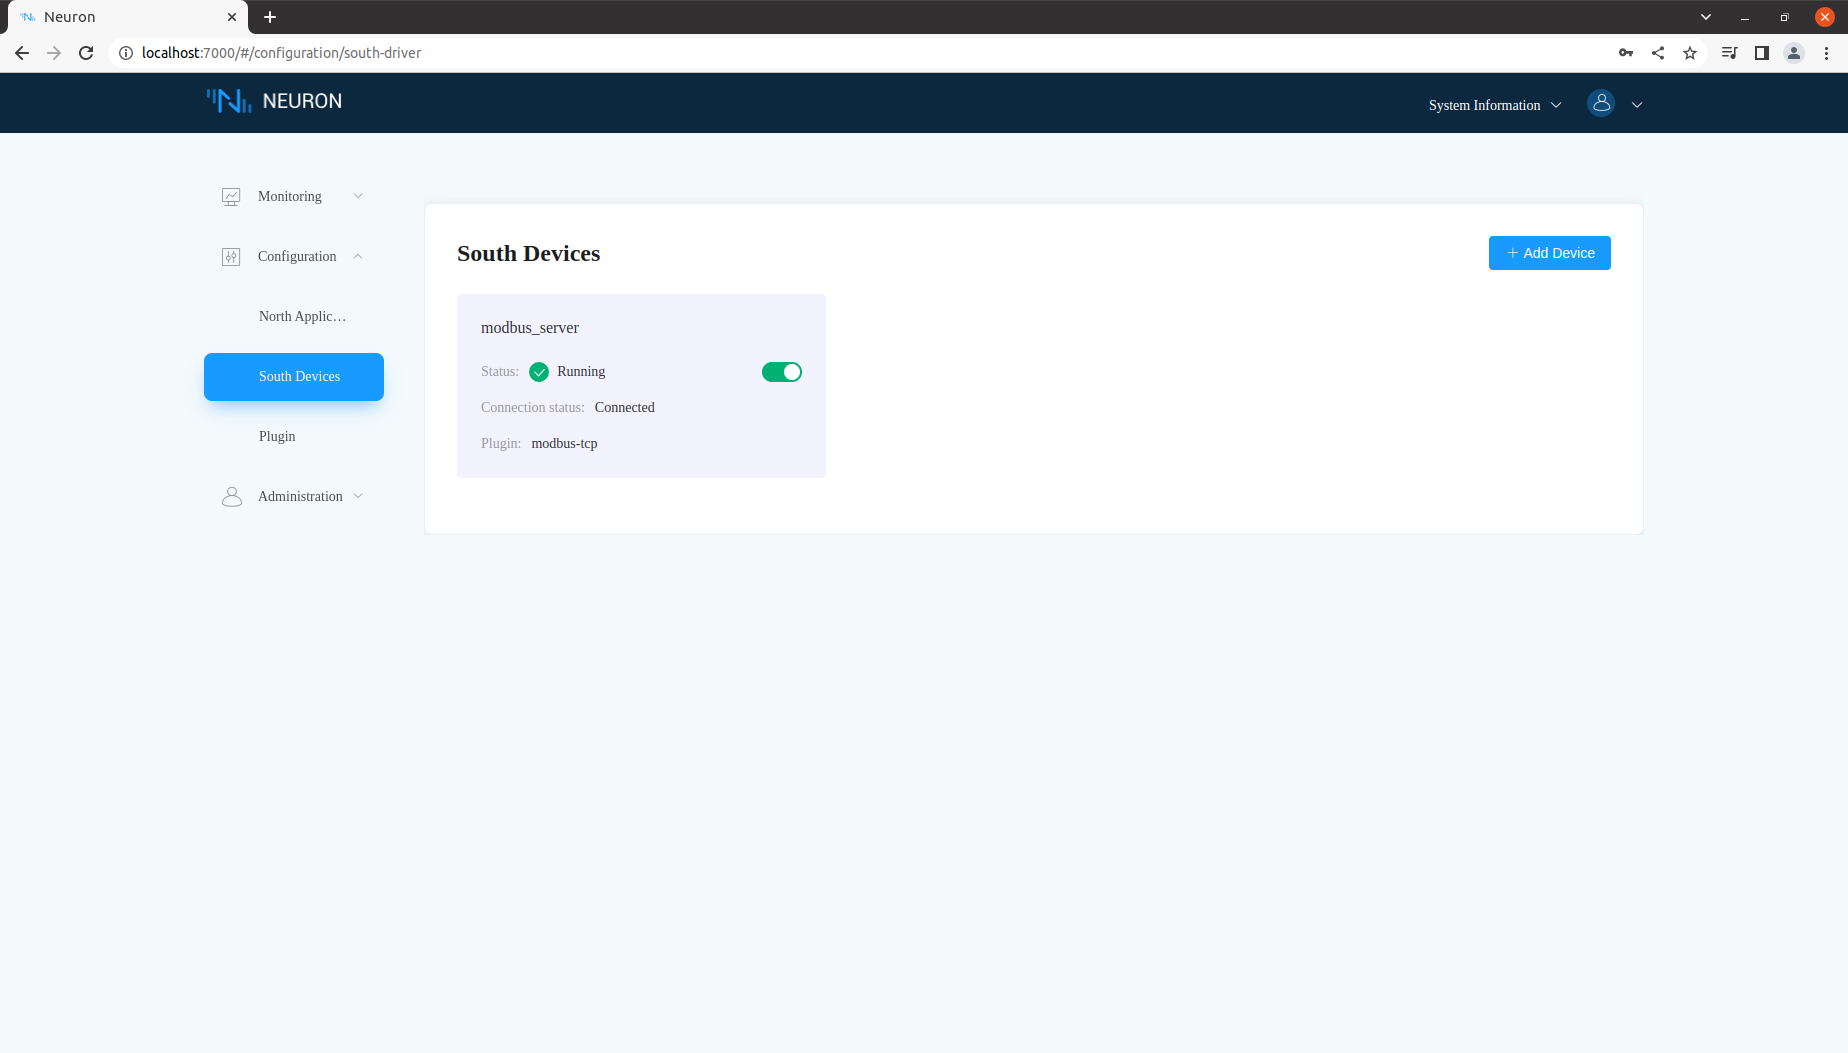
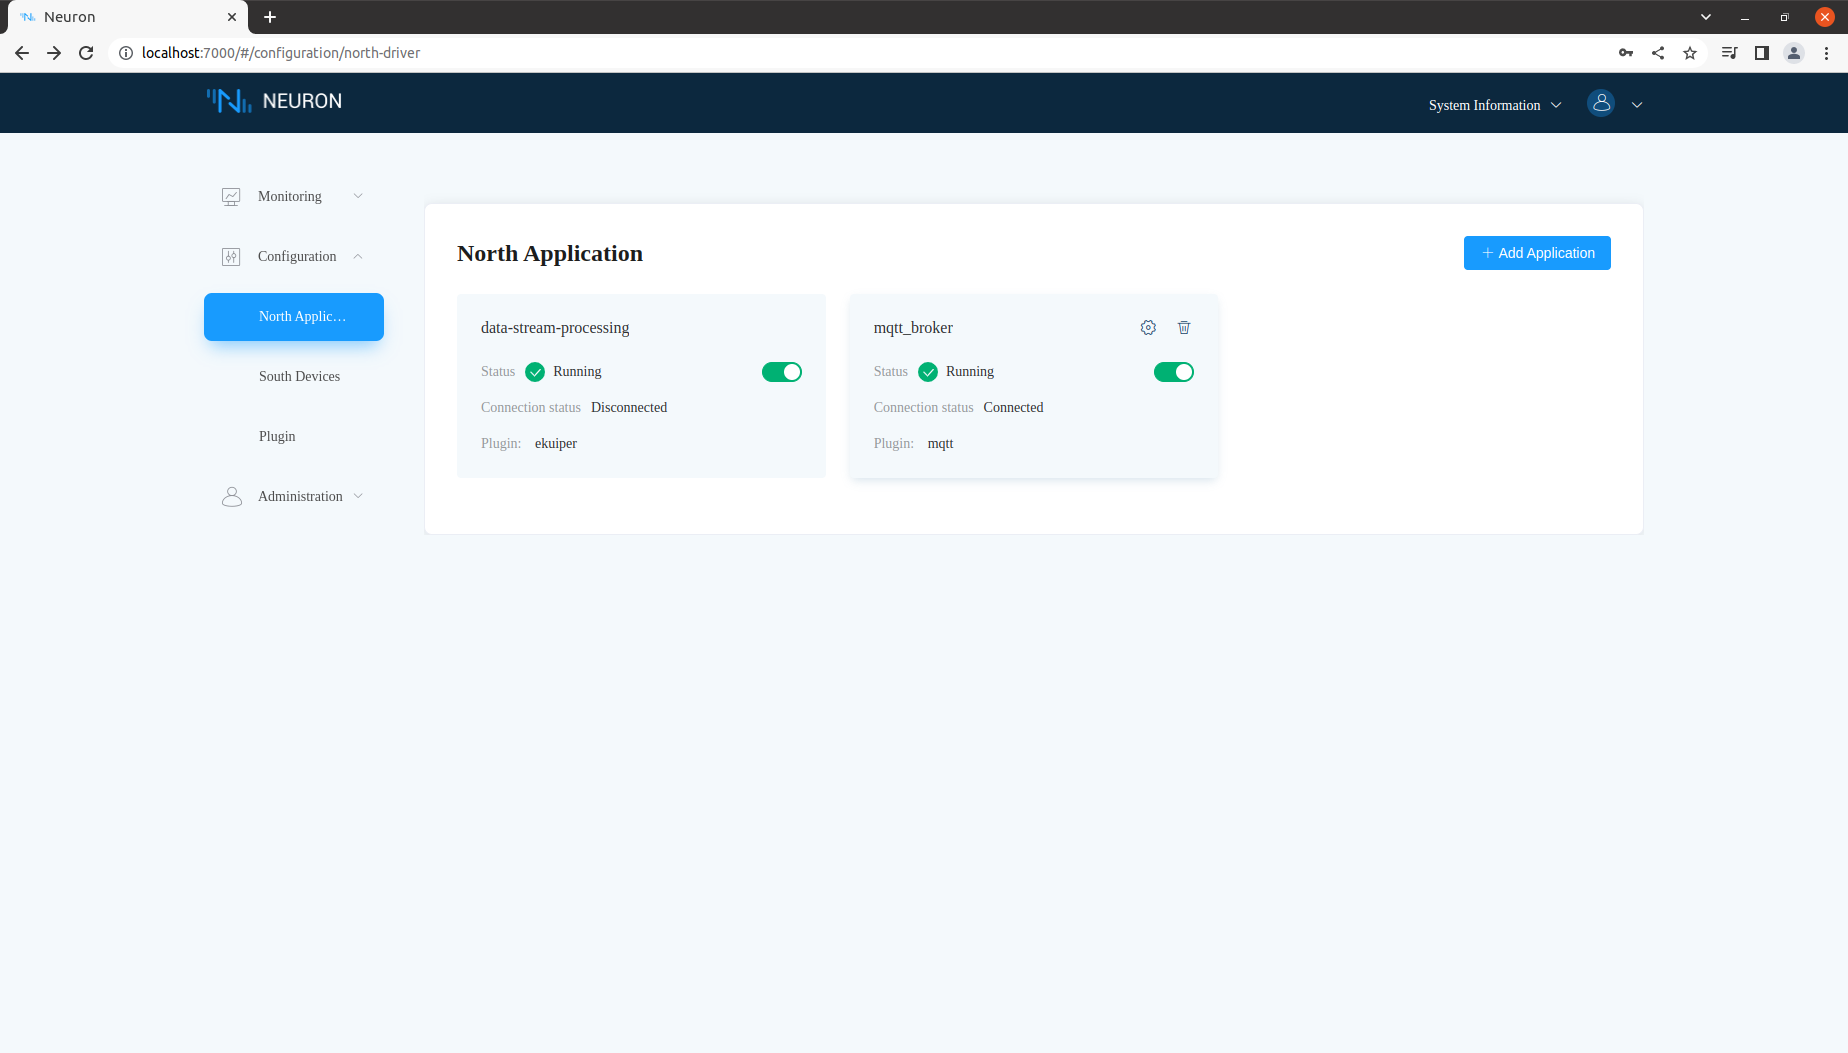
If successful, the connection status of mqtt_broker should be connected.
Step 3: Configure EMQX
- Open a web browser and type EMQX_IP:18083. Username is admin and the password is public.
- Click on Rule under the Rule Engine tab and create a rule.
- Add SQL Rule condition.
SELECT
  payload.timestamp as tstp,
  payload.values.tag1 as tag1
FROM
  "/neuron/mqtt_broker/upload"
Figure 9: Add SQL Rule
- Add action handler.
{“tstp”:${tstp},”value”:${tag1}}
Click Confirm after you finish.

Figure 10: Add Action Handler
Step 4: View Data from InfluxDB Log and Grafana
- Print InfluxDB log to view the connection with the command:
If successful, you can see the value=256 in the output, which is the value we set in the modbus-server.docker logs ia_datastore - Log into Grafana to monitor the data. Open web browser and type Grafana_IP:3000. Username is root and password is eii123.
Create a new panel and select ts_data in FROM, field(value) in SELECT.
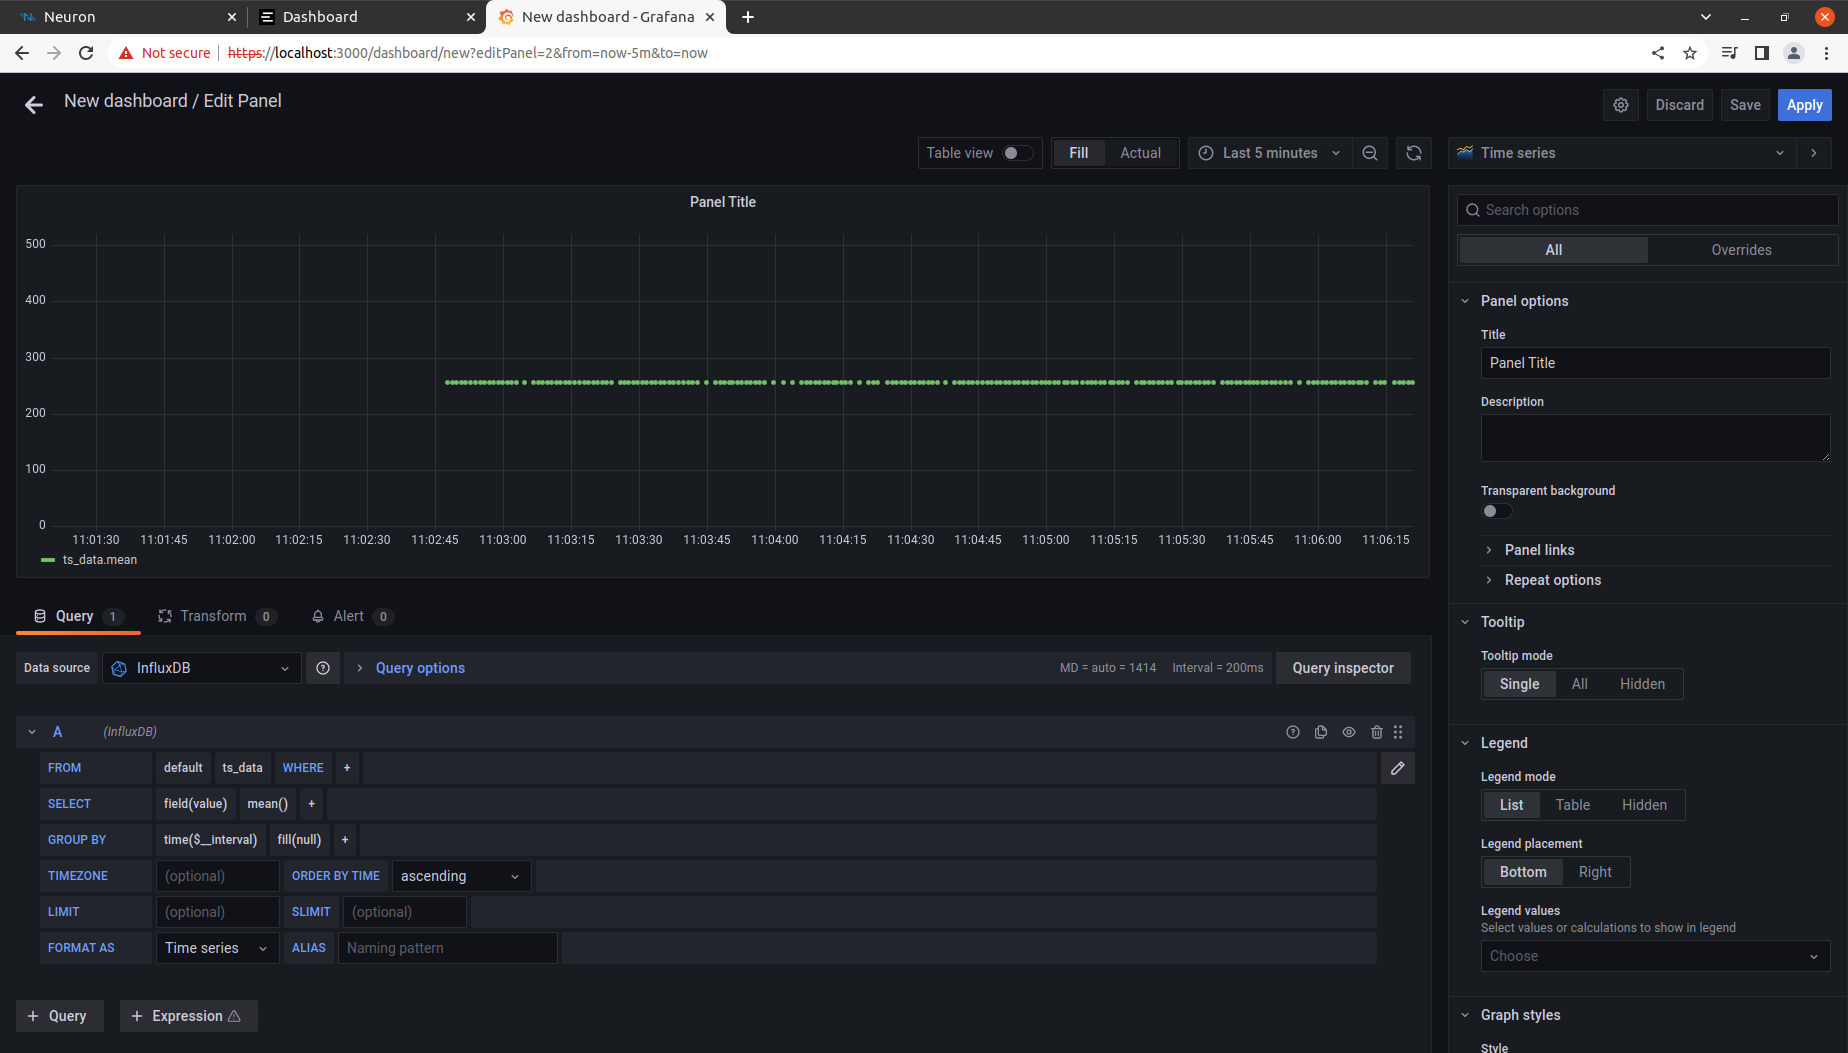
Figure 11: Grafana Log In Screen
Summary and Next Steps
After using EMQ IoT messaging platform with Intel® EII, you will receive industrial data with Neuron + EMQ X data ingestion flow integrated with the TICK stack in Intel® EII.
As a next step, add rules and algorithms, such as anomaly detection in Kapacitor*, to complete the full workflow of industrial data processing and monitoring.
Learn More
To continue learning, see the following guides and software resources:
Troubleshooting
To check if the connections of the Modbus simulator to Neuron and Neuron to EMQ X are healthy, find the connection status in the Neuron web console, as shown in the examples below.
Support Forum
If you're unable to resolve your issues, visit Forum, Slack or GitHub for technical support of Neuron and EMQ X.