Introduction
Intel® Graphics Performance Analyzers (GPA) offers a wide range of tools to analyze graphics applications across diverse workloads, platforms, and graphics APIs. Within Intel® GPA you can use Graphics Trace Analyzer to explore where you can distribute workloads evenly across CPUs and GPUs. This article will demonstrate how to configure your layout in Graphics Trace Analyzer to rearrange track layouts, alter colorization of tracks, and add or remove tracks to organize layout to best suit your use case. The expected outcome is a simple, yet very efficient, methodology for pinpointing CPU and GPU activity based on the capture platform and hardware metrics. Topics covered in this article can be visualized in video format in the Configure a Custom Layout video, by checking reference markers in the images associated with this article.
Pre-requisites
Before proceeding with this article, ensure you have the minimum system requirements to successfully analyze graphics applications using Intel® GPA. Also make sure you have downloaded and installed Intel® GPA on your host platform.
Add/Remove Tracks
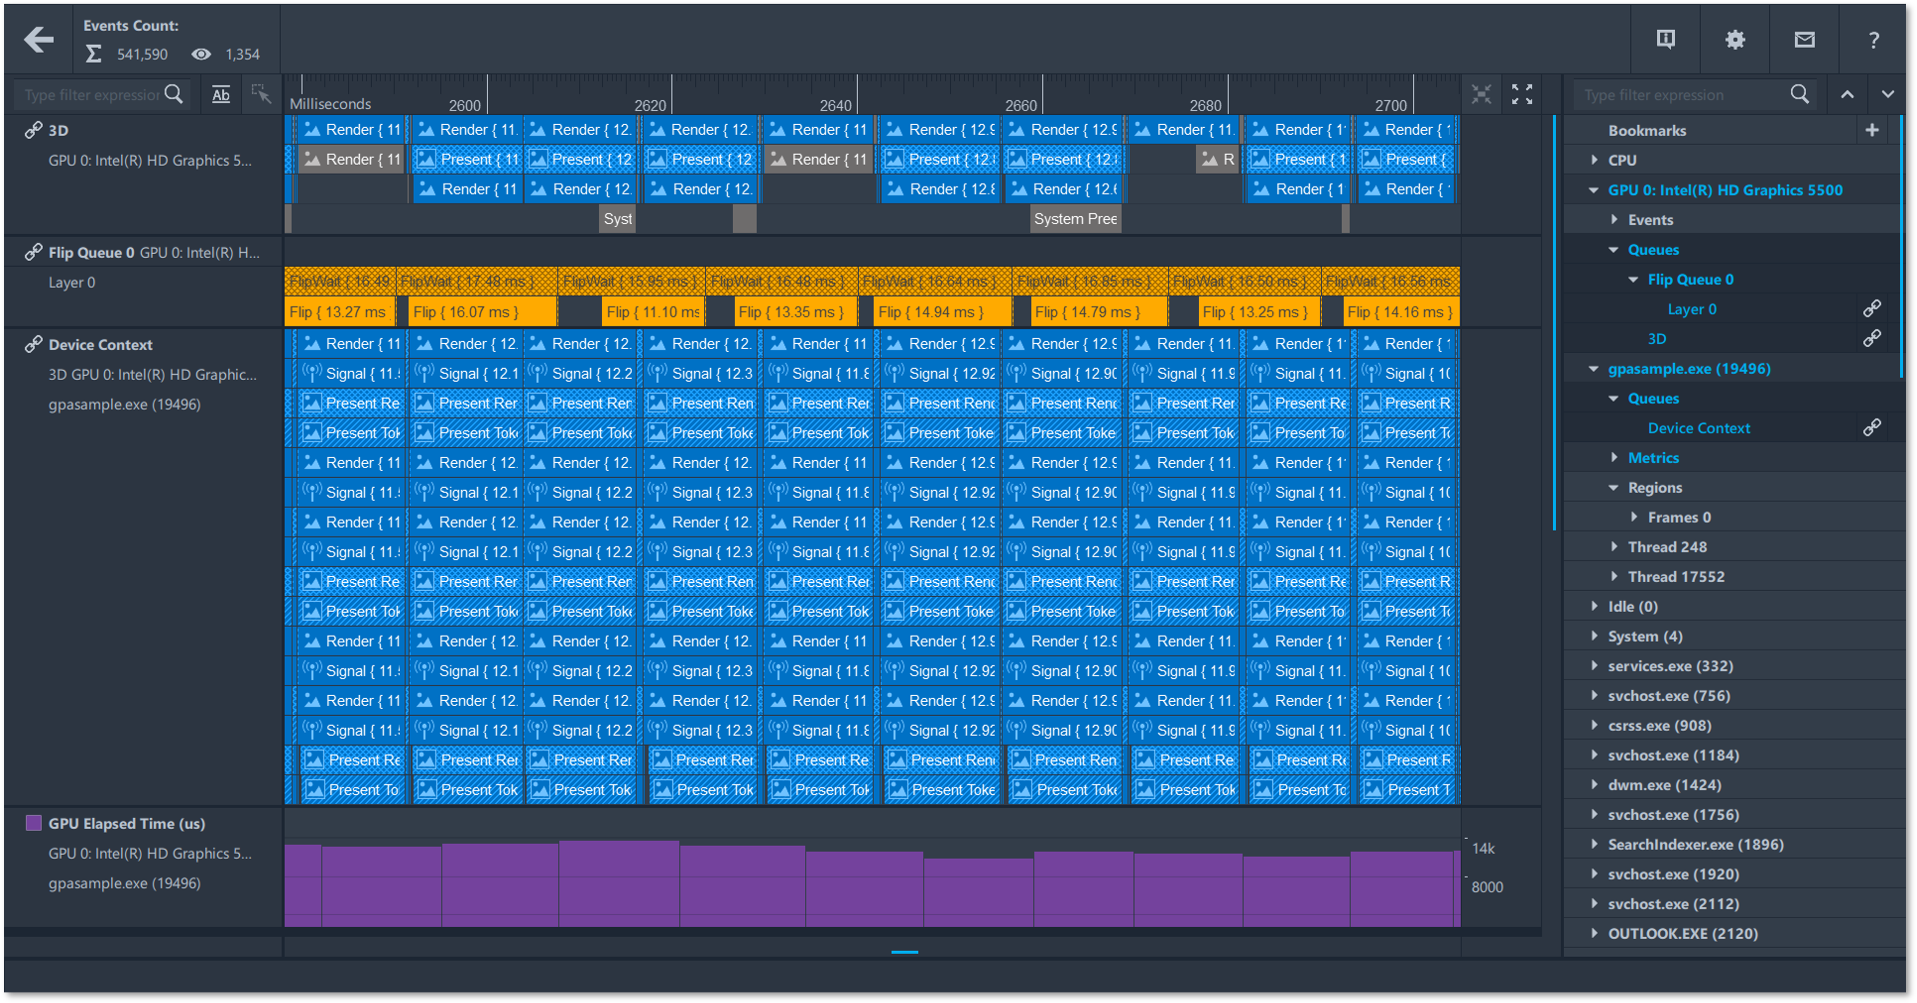
Let us explore a particular use case to highlight how beneficial layout customizability can be to your specific use case. Let’s say you want to tailor your layout in Graphics Trace Analyzer to examine the GPU utilization of your application. You can first turn off timeline visualization for many of the default tracks as they are unnecessary while analyzing the GPU utilization of your application. You can do this by either clicking on the name of each element you want to turn off in the content (right) panel of the tool or you can hover over the track in the timeline (center) panel of the tool and then press the X button to the right of that track’s data.
If you want to analyze GPU utilization in further detail, add desired metrics into the timeline of the tool. Clicking on the arrow (>) button next to the metrics parent element will expand the trace content tree to display all child elements. Hover over the desired metric and an icon will show up to the left of the metrics name allowing you to click and drag that metric to any desired position in the timeline.
Rearrange Tracks
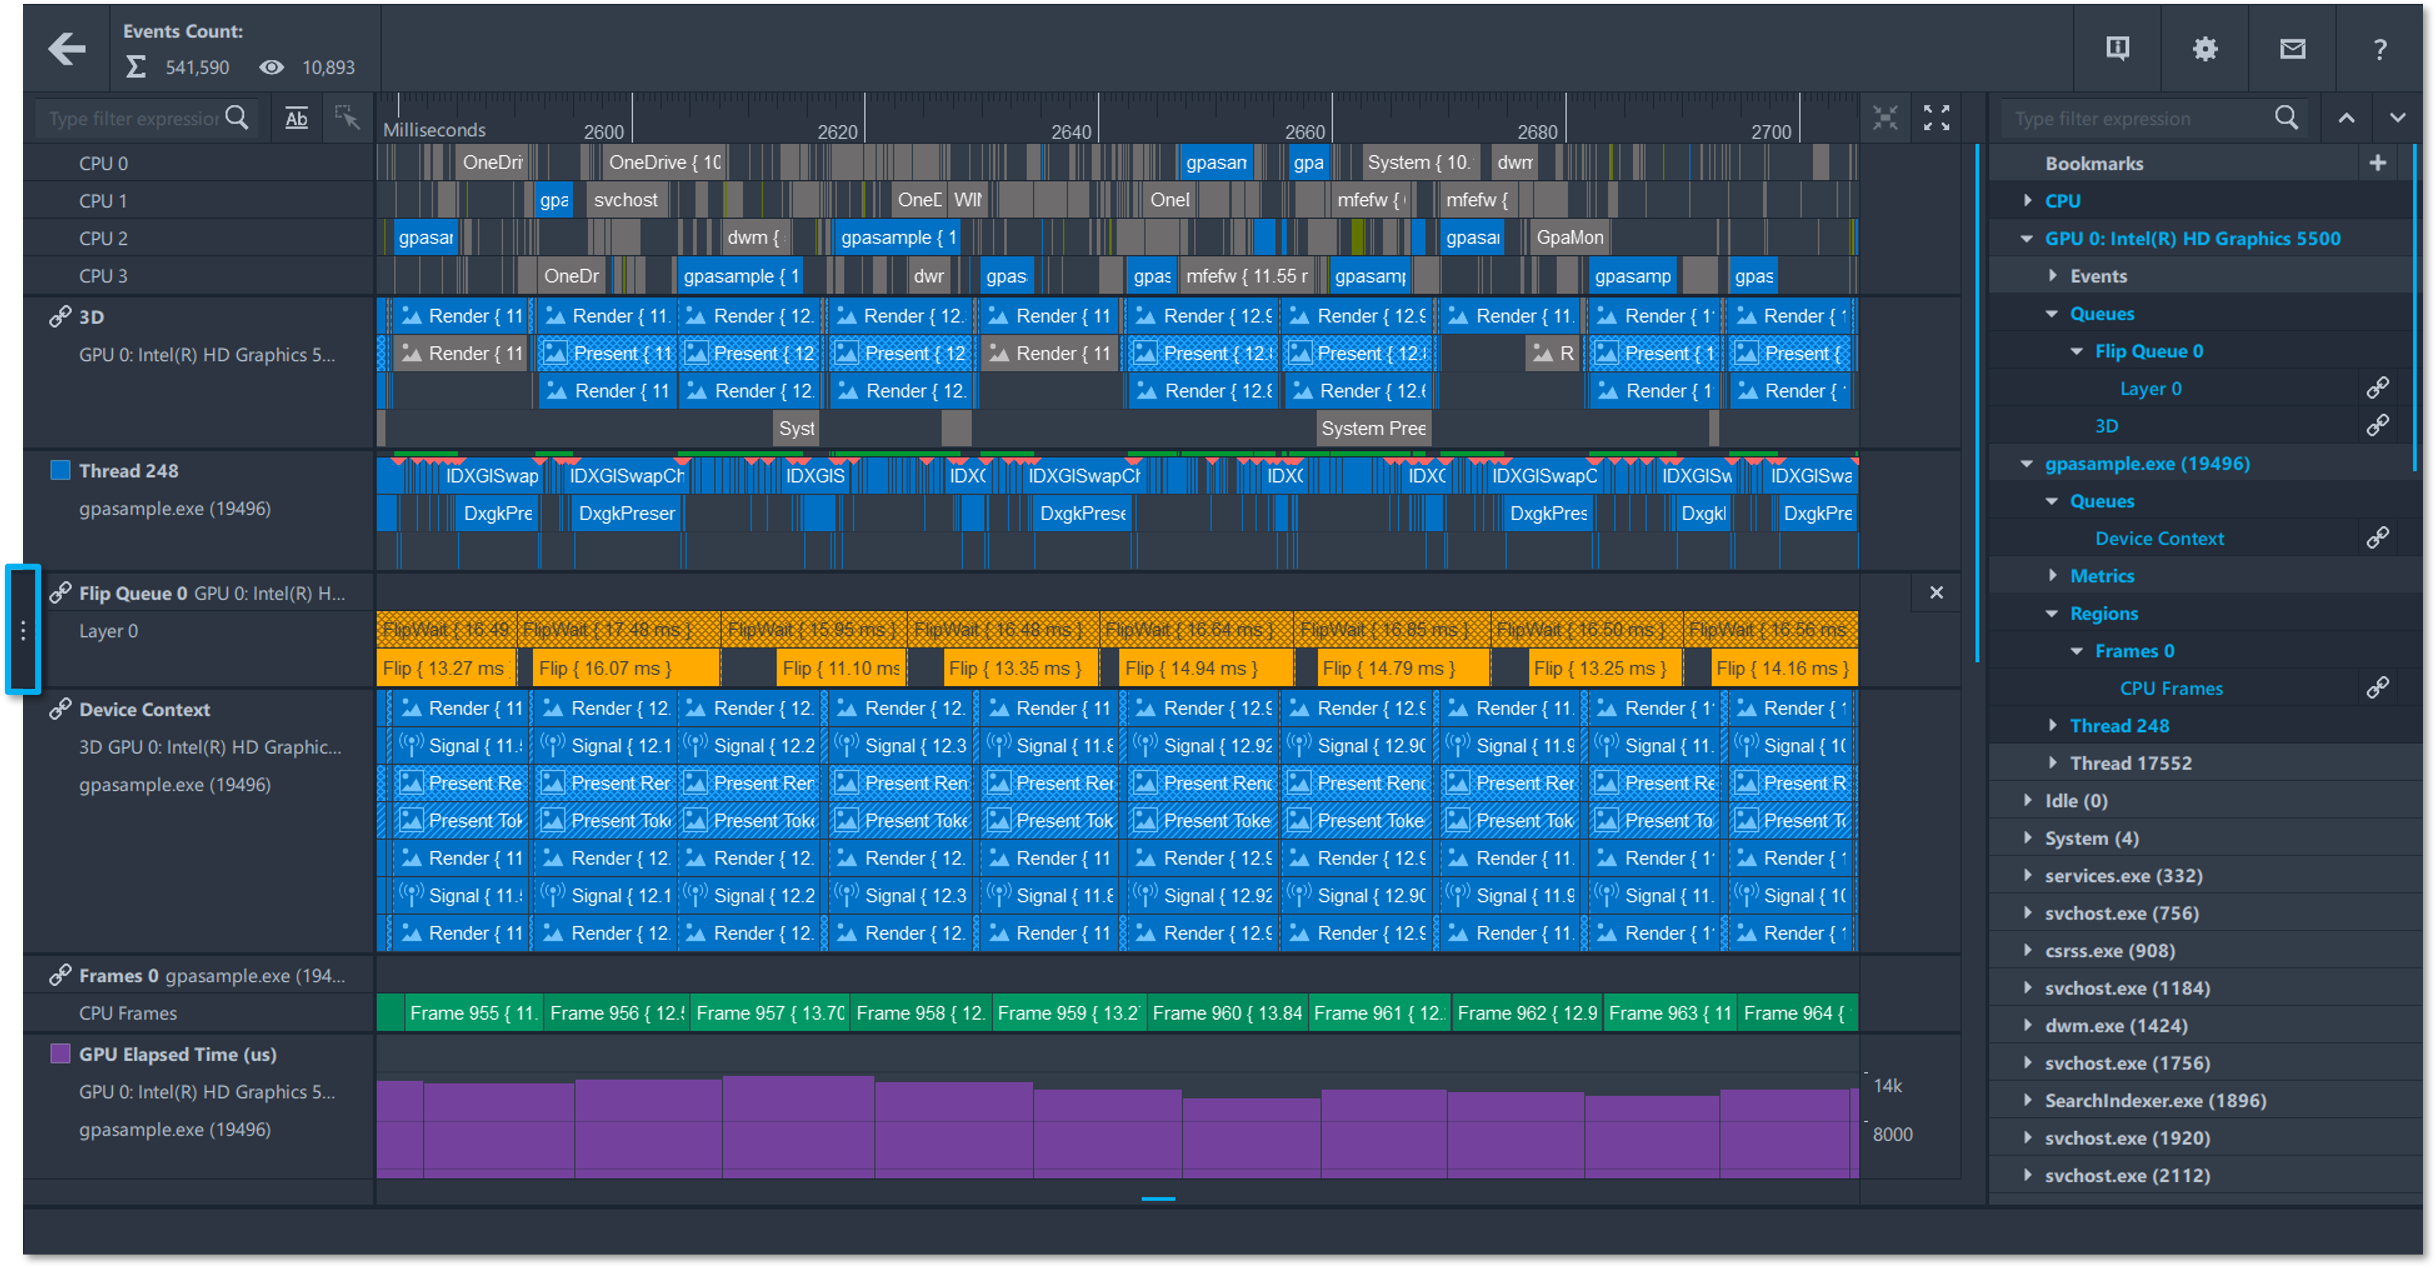
To correlate GPU utilization and device context queue content with graphics calls submitted by the application, you can add the corresponding tracks to the timeline. You can rearrange these tracks by hovering over the track title you want to adjust in the left panel of the tool, clicking on the icon that pops up to the left of the track title, and then dragging the entire track to a new position in the timeline.
Events shown in a thread track are logically separated for tasks and markers which can be analyzed separately or simultaneously. These makers can be visualized in the timeline by selecting a desired marker under the thread track that you’re currently analyzing. To view all markers for that thread, while at the same time excluding tasks, you can click on the thread’s name to enable all child elements and then select the tasks element to disable all tasks in that thread from timeline visualization.
Altering Colorization of Tracks
Now that suitable tracks have been enabled and adjusted in the timeline—appropriate for the analysis of GPU utilization—you can alter the color scheme for events, metrics, and markers. The default color scheme of Graphics Trace Analyzer is the most suitable for the system view and contains the following colors:
-
Blue: Events associated with a target process.
-
Dark Green: Instrumented processes running in parallel with a target process. For example, a child process or another graphics application launched prior to the target process.
-
Grey: All other processes.

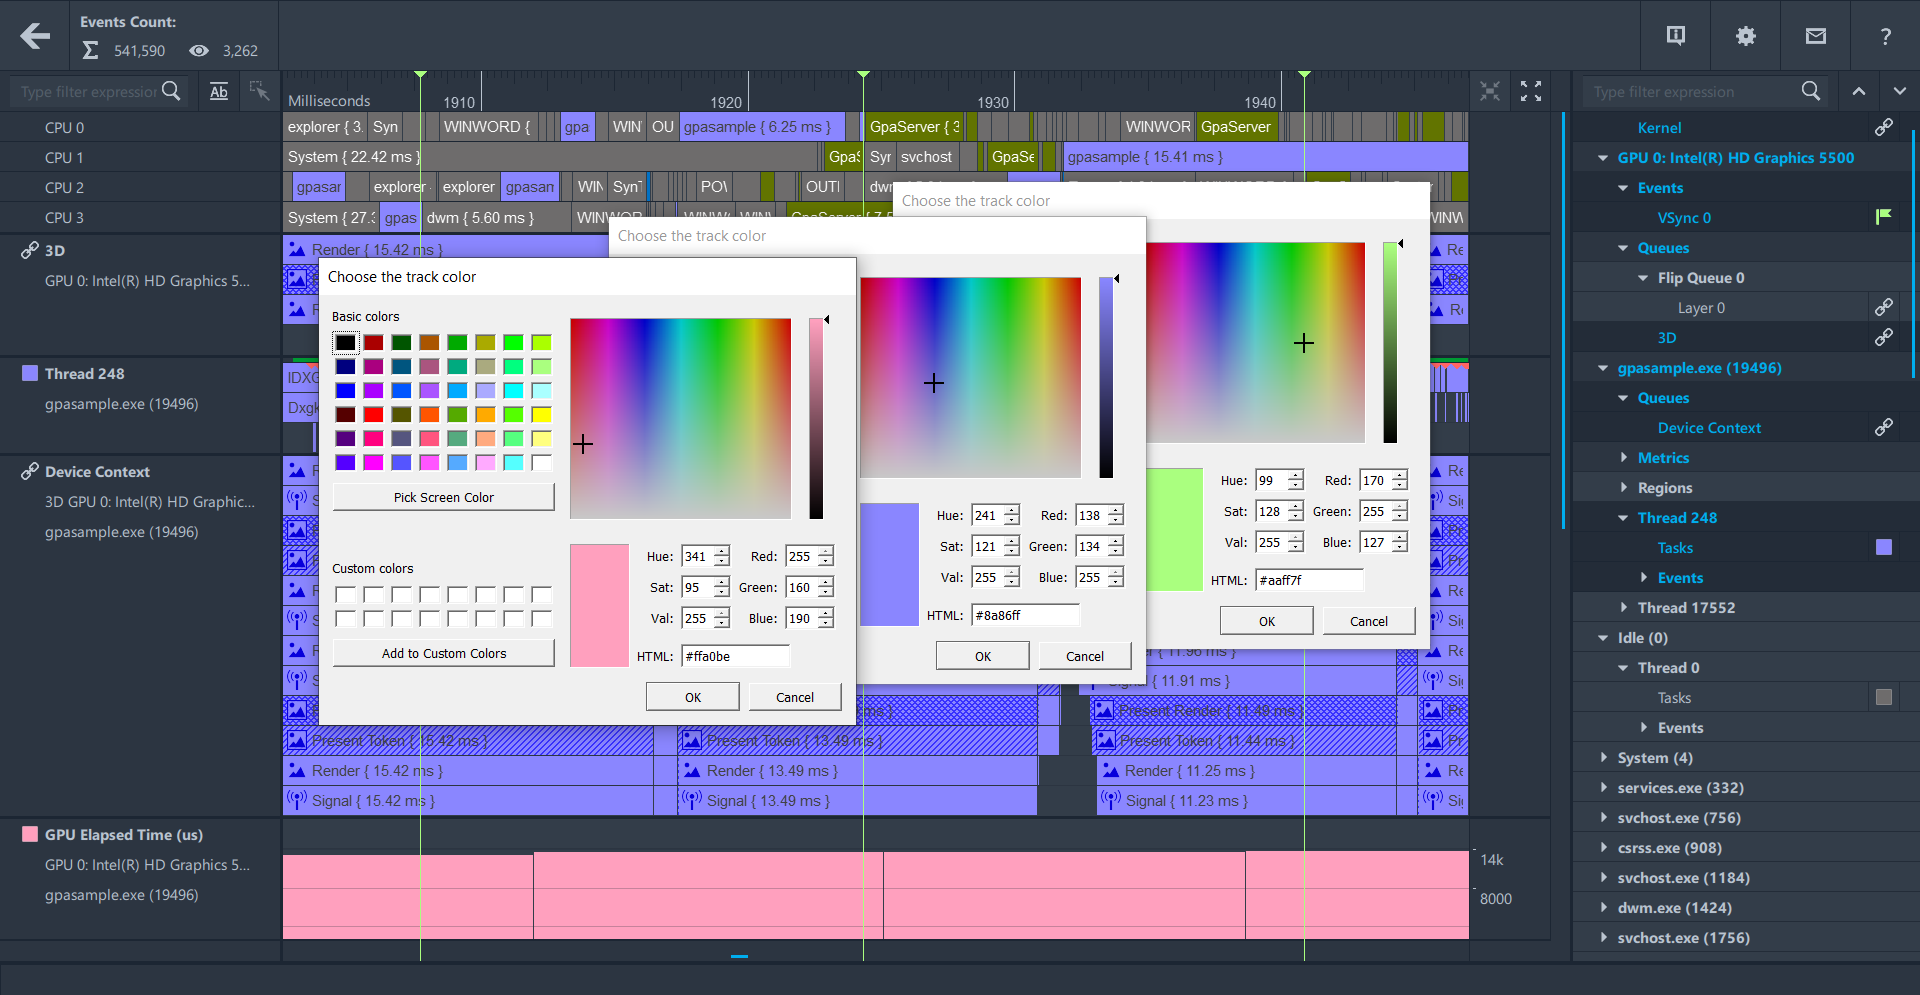
To alter the color of your tasks in a thread, locate the thread process in the right content panel of the tool then pinpoint the Tasks child element in the thread process tree. Double click on the colored square icon to the right of the element’s name and a color selection menu will pop up allowing you to select a new color for your tasks.
NOTE: Altering the color of tasks will impact the color of events in other tracks with dependent data. For example, changing the color of tasks in the main rendering thread will also change the color of queue packages submitted from that thread.
While viewing the thread processes in the right content panel of the tool, locate the marker child elements. The colors for these markers can be altered by selecting the flag icon to the right of the markers name and then by selecting a different color for that marker in the color selection menu that pops up.
Track colors can also be changed in the left panel of the tool by locating a track, then double-clicking on the square icon to the left of the track’s name, and finally, selecting a different color for that track.
A good example of using differing track colors to their fullest potential is by altering the color of metric tracks to distinguish different types of metric data such as percentages, cycles, microseconds, pixels and more.
NOTE: You can change the color scheme and scale of Graphics Trace Analyzer by pressing the cog wheel in the top right-hand corner of the tool and then by selecting your preferences under the appearance settings options.
Conclusion
This article demonstrated how to configure a custom layout to add or remove tracks, rearrange tracks, and alter the colors of your tracks and markers in the timeline (center) panel of Graphics Trace Analyzer. For more information on how to identify and analyze problem areas in your applications to distribute workloads evenly across CPUs and GPUs, continue reading the Graphics Trace Analyzer Deep Dive articles.
Additional Resources
Part 1: Configure and Capture Trace (Article)
Part 2: Open and Explore Trace (Article)
Part 3: Configure a Custom Layout (Video)