Introduction
Intel® VTune™ Profiler, a component of the Intel® oneAPI Base Toolkit, enables analyzing Data Plane Development Kit (DPDK) applications, including DRAM, PCIe, UPI (socket interconnect traffic), and system bandwidth, and processor frequency. It highlights when DPDK threads are in "empty" polling loops and throughput through each of the DPDK devices to identify how balanced the data packet traffic is on the system.
The Data Plane Development Kit is an open source project managed by the Linux* Foundation available for download.
DPDK provides a set of libraries and polling mode drivers for packet processing in user space. Working in user space allows using huge pages and polling mode that enables higher packet throughput than is possible using the interrupt-driven processing provided in the kernel.
On a traditional I/O path, the CPU is either doing something useful or is waiting on I/O. DPDK interfaces with I/O devices in polling mode, which means processor cores are running all the time. One obvious disadvantage of polling is that it can waste a lot of processor time with low traffic. Currently, there is no accepted method of accounting for "spinning I/O wait" cycles introduced by polling I/O model.
DPDK also completely bypasses the kernel, so we lose access to handy kernel tools like iostat, blockstat, and many others.
So performance debugging of DPDK application becomes a real challenge, mostly because standard tools are either inapplicable (as in the case of measuring I/O performance), or just give a trivial answer (as in the case of CPU utilization). They are also not useful for resolving processor core instruction pipeline and un-core micro-architecture issues.
This is where VTune Profiler can provide better performance insight and a complete picture of I/O performance.
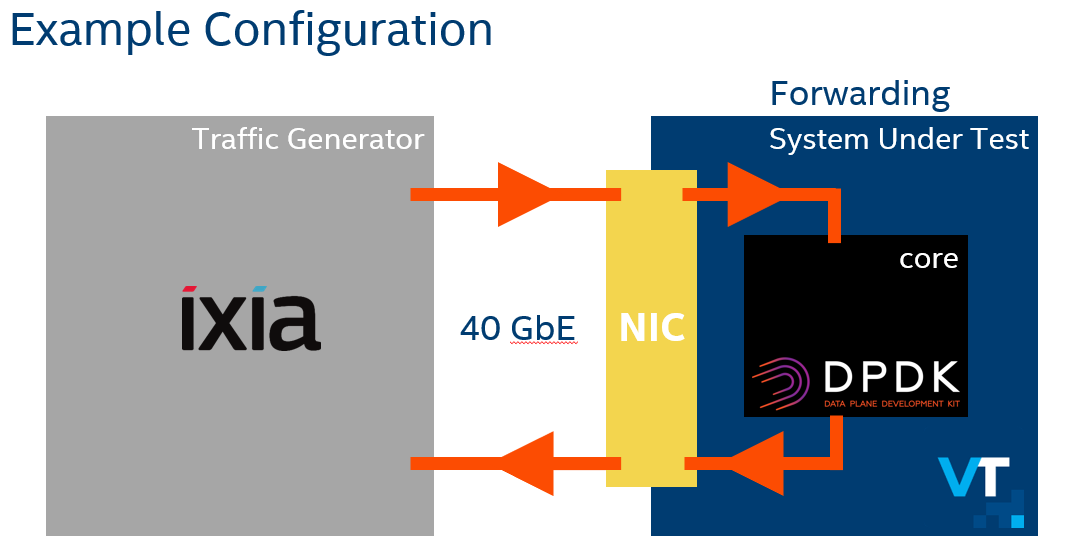
At a high level, performance tuning DPDK applications consists of understanding three things: processor utilization, how the application passes through the framework, and performance monitoring of physical interfaces. This helps identify bottlenecks such as bandwidth limits of any physical links. VTune also provides insights into a DPDK application’s micro-architecture issues with the processor core pipeline and with data traffic un-core issues such as DDIO (looking at the performance from the I/O device’s perspective).
Set up
Enable tracing of loop iterations that yielded no packets in a DPDK application, recompile with the flags specified.
After the DPDK (target) system is configured, download and install the Intel oneAPI Base Toolkit, which includes Intel VTune Profiler, on a "host" system. See the Get Started instructions for detailed installation instructions.
DPDK Analysis
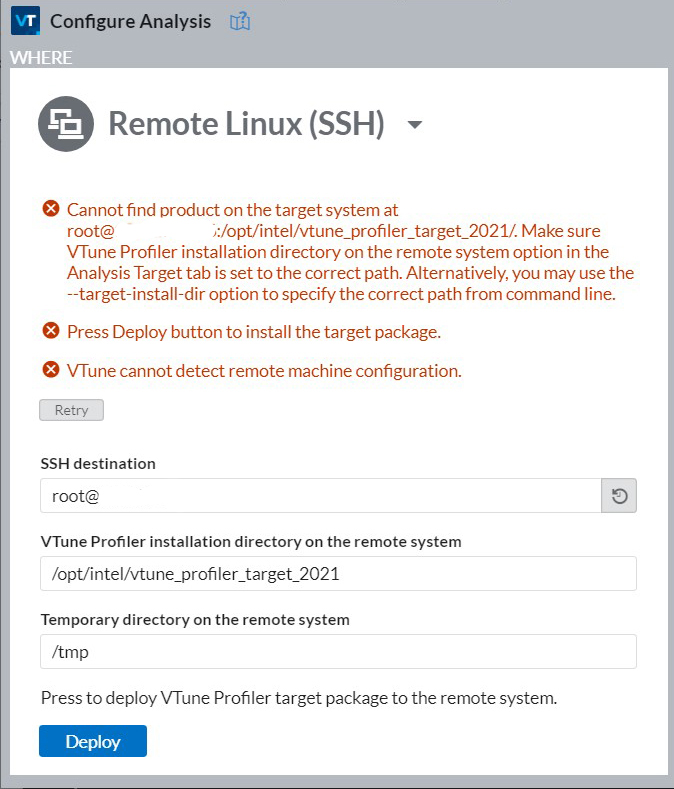
Start the VTune Profiler GUI and configure remote SSH target connection to DPDK system. Alternatively, configure the VTune Profiler web server mode and configure a connection to the DPDK system.
If this is the first time you are connecting to the target system, VTune Profiler will guide you through deploying a public SSH key to the target system. If VTune Profiler reports that it is unable to detect the target data collection package on the target system, click the "Deploy" button.
Select Launch Application and specify the path to the DPDK application on the target system.
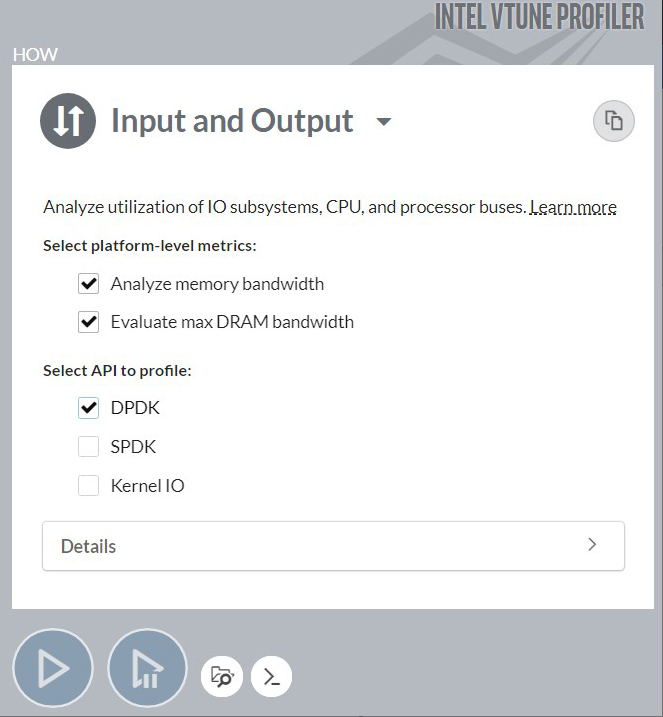
Select Input and Output analysis and check the DPDK checkbox.
Also check the Analyze memory bandwidth and Evaluate max DRAM bandwidth checkboxes.
Click the start button to start the application and performance data collection on the DPDK target system.
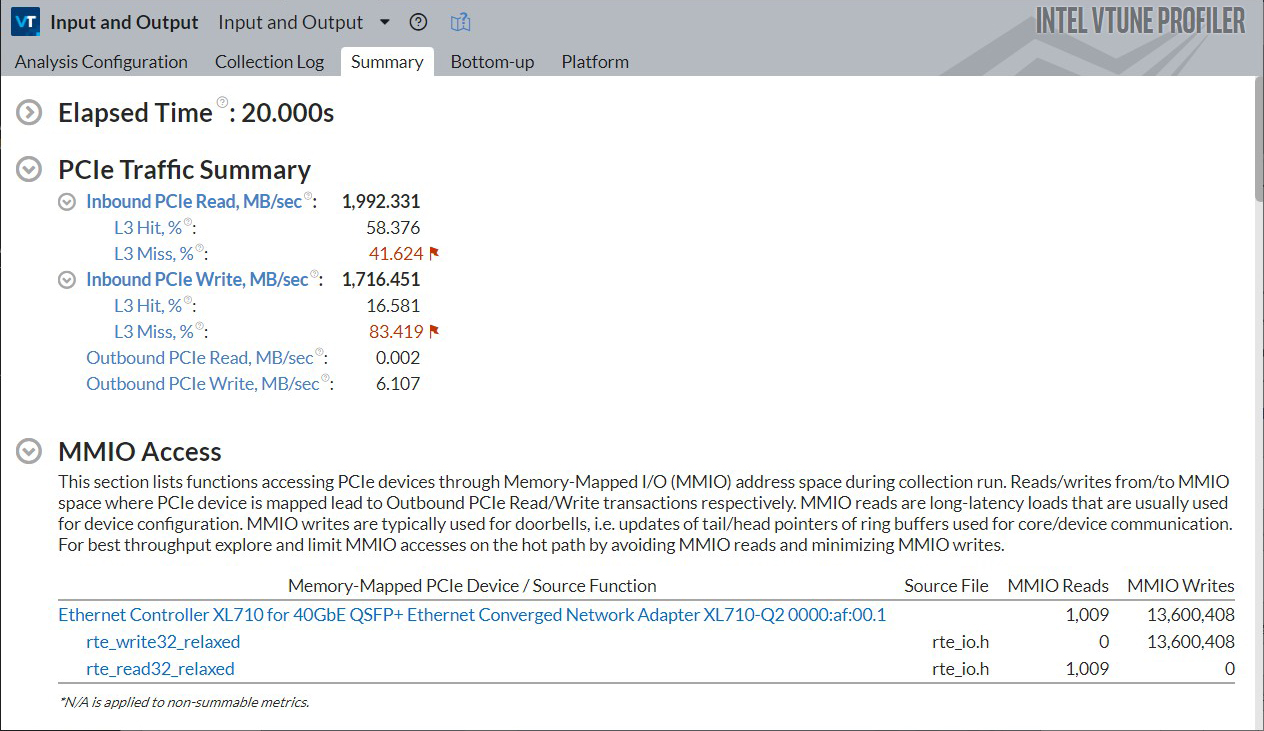
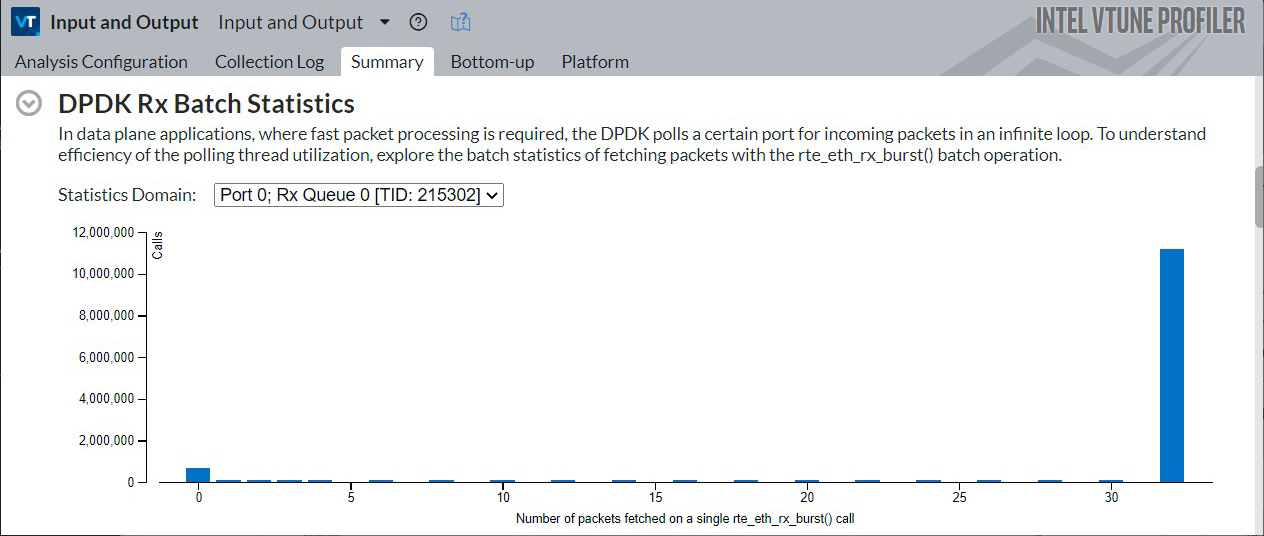
After the application and data collection have completed, VTune Profiler displays a "Summary" tab with high level results. These include PCIe traffic summary, Memory Mapped I/O (PCIe outbound initiated by CPU to device via MMIO), DPDK receive statistics, and PCIe bandwidth utilization histograms that help analyze I/O performance.
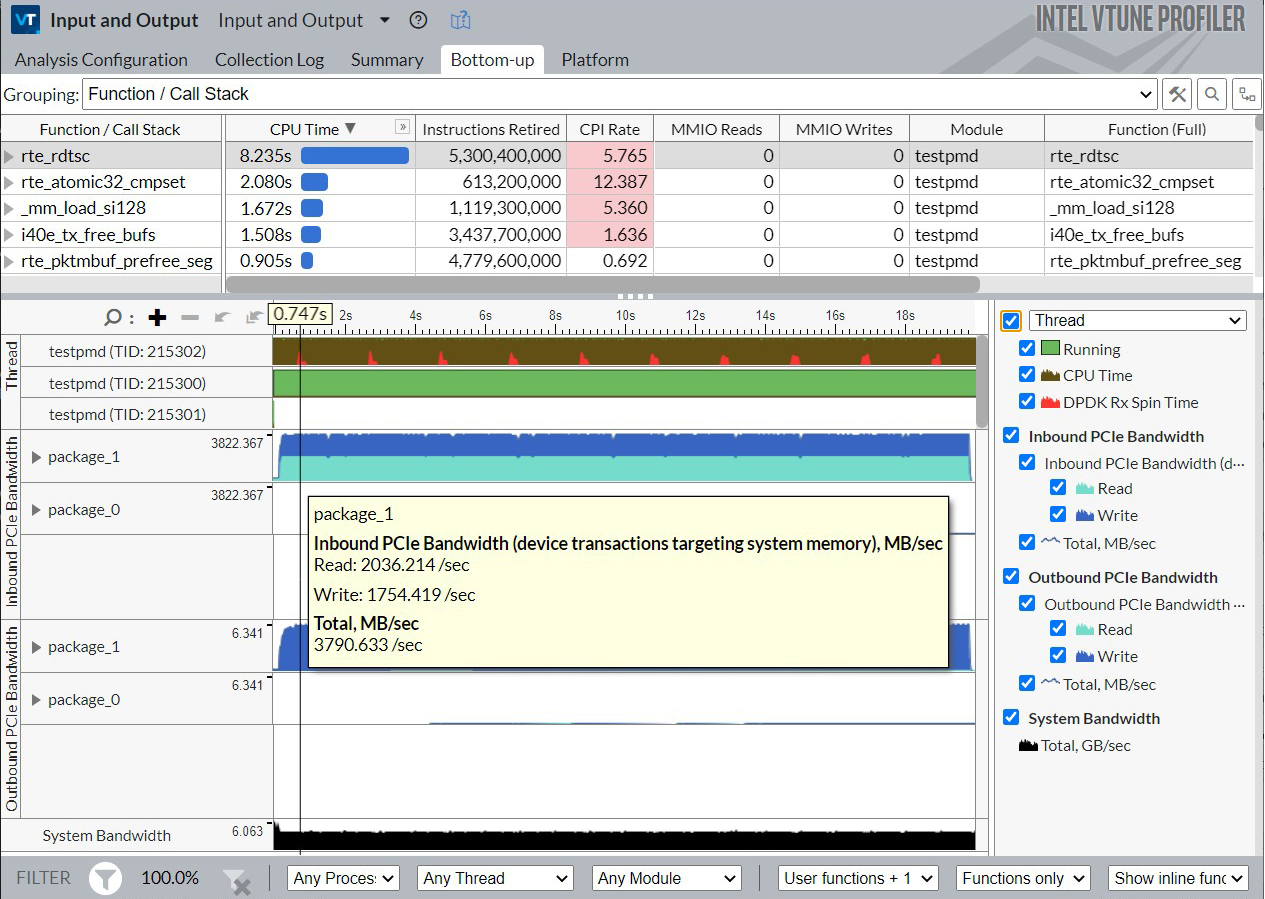
Click the Bottom-up tab to see more details specific to the DPDK application.
The top pane, with "Input and Output" viewpoint and "Function / Call Stack" grouping, displays DPDK application functions, ordered by most processor time consuming to least.
The bottom pane displays DPDK threads' processor utilization and read spin time, as well as inbound PCIe bandwidth (device transactions targeting system memory) and outbound PCIe bandwidth (CPU transactions targeting device’s MMIO space).
Mouse hover over the timeline to see additional details.
DPDK Rx Spin Time is defined as the number of receive burst calls returning zero packets divided by the total number of receive burst calls multiplied by 100%. Select a portion of the timeline where "DPDK Rx Spin Time" is rapidly increasing or decreasing to zoom and filter in on just that window of time.
If the spin time is often low, verify the I/O performance is sufficient for your solution. There may be an opportunity to improve the I/O performance by adding more cores to the DPDK solution. You can also explore the efficiency of your code by running a micro-architecture exploration analysis on your application.
If the spin time is often high, your solution may have the potential to improve efficiency by adding more network devices to your core.
If these metrics are reasonable but the system is underperforming performance targets, verify the platform I/O traffic (e.g., PCIe bandwidth) to identify whether a physical interface is saturated.
The Platform tab displays inbound and outbound PCIe bandwidth, DRAM bandwidth, UPI bandwidth, and CPU frequency metrics.
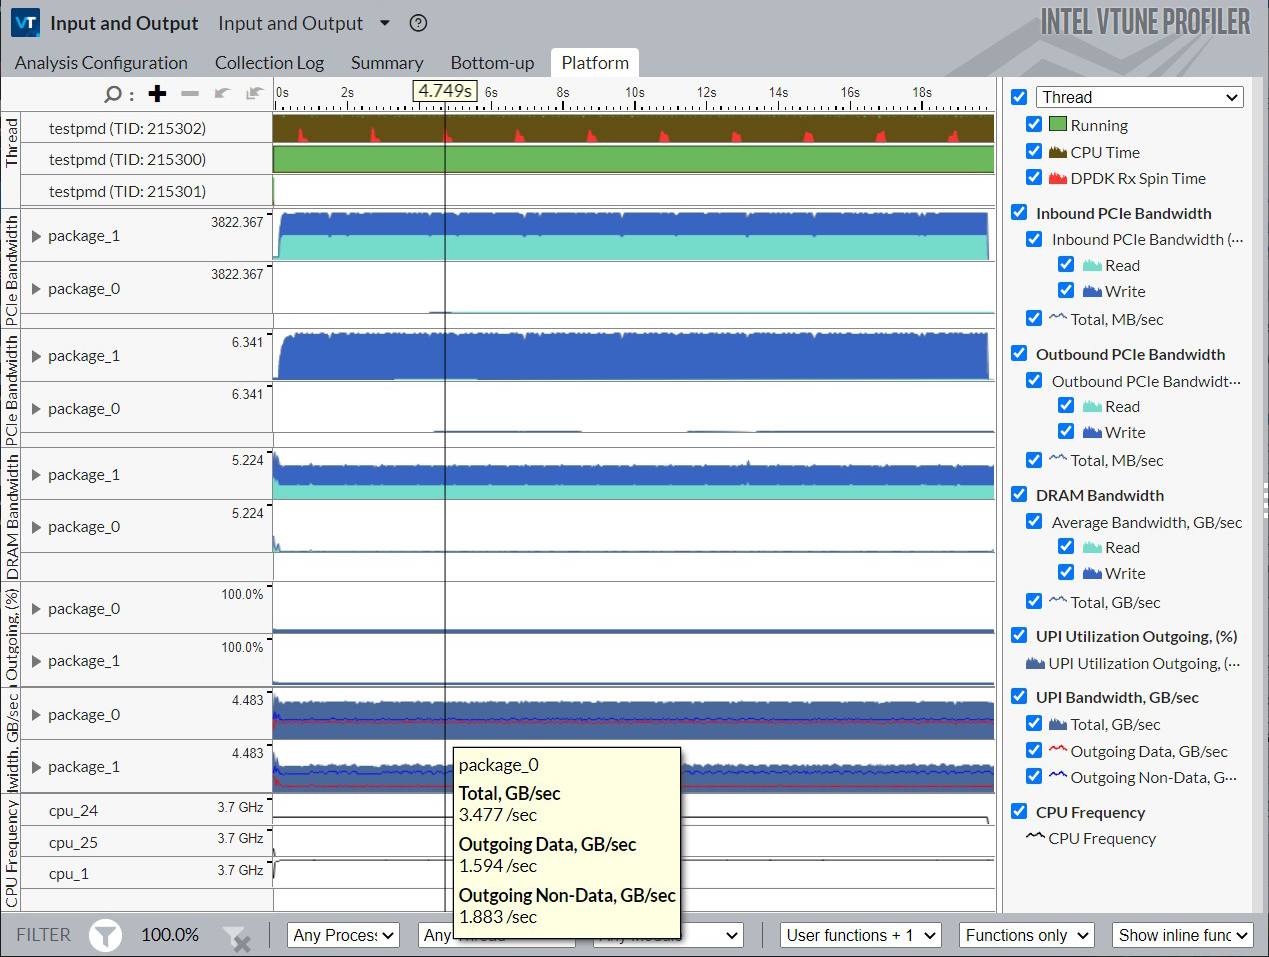
High UPI traffic may indicate that data is received on a network device near one socket, but the software process consuming that data is running on another socket. If that is the case, there may be an opportunity to improve performance by assigning processor affinity of that software process.
Conclusion
This article demonstrates how to use Intel VTune™ Profiler from the Intel oneAPI Base Toolkit to analyze DPDK applications and identify potential system performance bottlenecks or excess headroom.
For more information on using VTune Profiler to analyze the performance of DPDK applications, see the following Intel VTune™ Profiler cookbook articles:
- Core Utilization in DPDK Applications
- PCIe Traffic in DPDK Applications
- Effective Utilization of Intel® Data Direct I/O Technology