When designing a software application, there are a variety of heterogeneous system configurations available, making it a challenging task to efficiently leverage the computational capabilities of multiple devices, especially when targeting multiple such configurations.
The same is true when optimizing existing code to yield a high-performance application that takes full advantage of your hardware setup. Sometimes, designing performant code and further optimizing it requires you to understand the underlying hardware so that your application can achieve its full potential. You want to balance the potential overhead of managing workload dispatch on a multi-architecture platform against software portability and performance potential.
To make designing and optimizing highly performant application code easier, the oneAPI programming model provides a flexible tool called Intel® Advisor. This design and analysis tool helps you:
- Design and optimize code for scalable parallel execution through task and thread management.
- Identify the best ways to have efficient vectorization, GPU offloading, memory usage, and thread-parallelism.
- Analyze your code and presents you with the dependency flow graphs, a great way to explore the dependencies and understand the execution flow of your application.
- Code across diverse architectures with support for C, C++, SYCL*, Python*, Fortran, OpenMP* and OpenCL™.
In this blog, we focus on important aspects of performant application design and optimization that Intel Advisor can help you with. Namely:
- Roofline analysis
- Vectorization insights
- Estimate effects of GPU offloading
- Explore threading design
Let’s take a look at each.
Roofline Analysis
Intel Advisor lets you analyze the actual performance of your C, C++, SYCL, Fortran, OpenMP, or OpenCL code against the ideal potential of the hardware platform (a CPU and/or a GPU) on which the application is running. You can visualize such an analysis in the form of a roofline chart and decide upon the steps required to optimize the code.
A roofline report helps you determine the hardware-bounded limitations or the architecture such as memory bandwidth and compute capacity. You can recognize the factors driving the current application performance and visualize the scope of improvement for each of them.
A roofline chart plots arithmetic intensity* (on X-axis) against performance** of the application (on Y-axis). Memory bandwidth and compute capacity limitations are plotted in the form of diagonal and horizontal lines, respectively. The dots on the chart correspond to offload threading kernels for GPU Roofline and individual loop/function for CPU Roofline. The size and color of a dot is based on execution time of the loop/function/kernel it represents.
Here is what a CPU roofline chart looks like:

Figure 1. Generalized View of a CPU Roofline Chart
A CPU roofline report generated by the Intel Advisor appears as follows:

Figure 2. Sample CPU Roofline Report
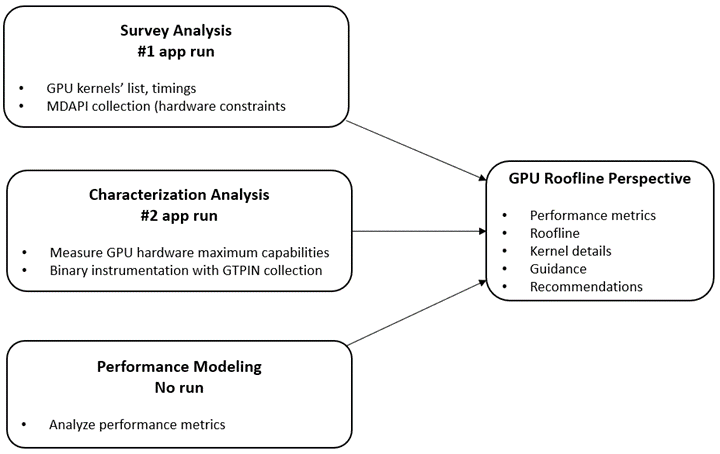
Roofline Analysis collects data by executing the application twice: First, it collects timing and available parallel kernel data. Second, it characterizes the hardware capabilities and collects additional binary instrumentation-assisted execution flow data. The results of the runs are then correlated to provide the metrics and recommendations displayed as part of the Roofline Perspective.
The following chart depicts the GPU roofline analysis flow:

Figure 3. GPU Roofline Analysis Flow
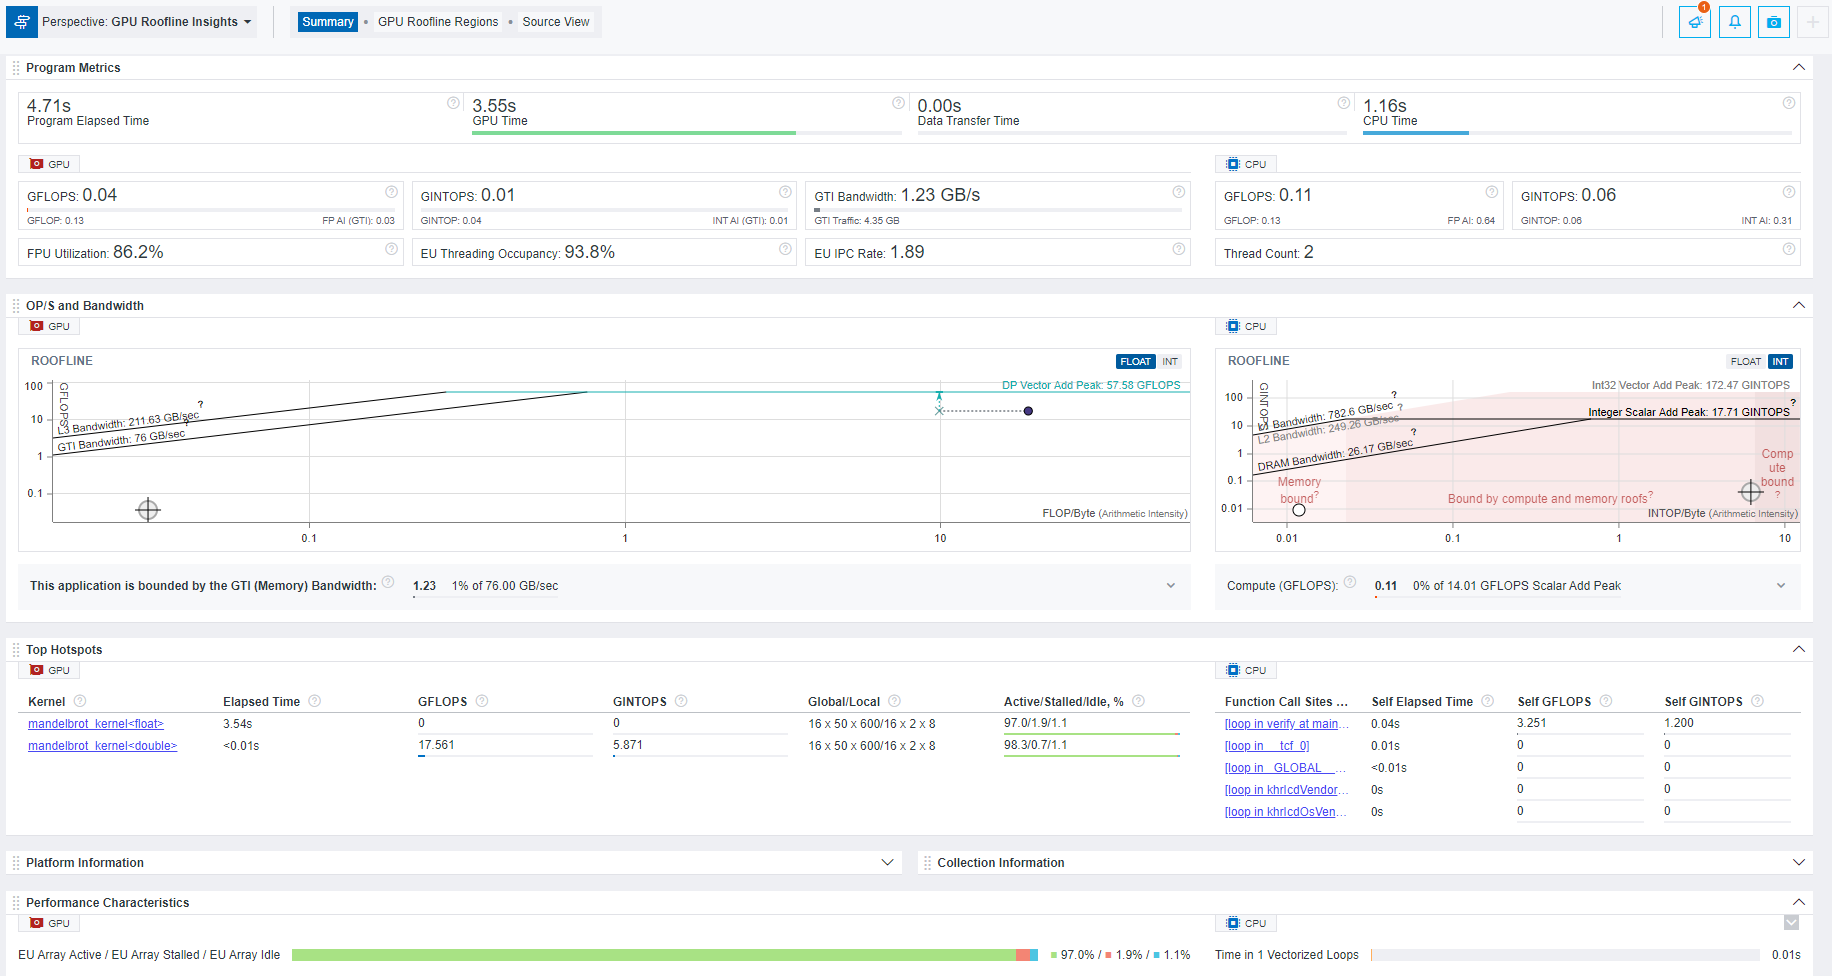
A GPU roofline report generated by the Intel Advisor appears as follows:

Figure 4. Sample GPU Roofline Report
→ Learn more about CPU/memory roofline analysis and GPU roofline analysis with Intel Advisor.
* Arithmetic intensity refers to the number of floating-point operations (FLOPs) and/or integer operations (INTOPs) per byte, transferred between memory and your CPU, GPU, or VPU (Vision Processing Unit, an AI accelerator).
** Performance here is measured as billions of floating-point operations per second (FLOPS) and/or billions of integer operations per second (INTOPS).
Vectorization Insights
Vectorizing a loop enables applying the same operation to multiple pieces of data simultaneously. With efficient vectorization of loops, you can take full advantage of SIMD (Single Instruction, Multiple Data) parallel processing technique on modern Intel® processors. Given that compilers such as Intel® oneAPI DPC++/C++ Compiler, Intel® C++ Compiler Classic, Intel® Fortran Compiler Classic and GNU Compiler Collection (GCC) can auto-vectorize some of your loops, serial limitations of programming languages restrict their vectorization capabilities.
With Intel Advisor, you can keep a check on how efficiently the loops get vectorized in a CPU-bound application. This helps with achieving extended vectorization width and better application performance. Intel Advisor lets you know about the top time-consuming loops and vectorization efficiency of each vectorized loop/function as well as the whole application.
It recommends some vectorization-based ways to fix application performance issues. For instance, it determines which parts of the application will yield the best performance results when applying vectorization. You can:
- Identify which loops were not vectorized and why
- Locate the vectorized loops and check whether each of them is beneficial
- Get to know the reason why vectorization of certain loops is not advantageous
Here is what a vectorization summary generated by the Intel Advisor looks like:

Figure 5. Sample Vectorization Summary
→ Know more about getting vectorization insights with Intel Advisor.
Estimate Effects of GPU Offloading
Offloading a CPU application (or certain tasks of the application) to a GPU results in faster computations and higher application performance for compute-intensive, parallelizable, non-memory-bound workloads.
BUT …
Before designing your application for accelerator offloading, it is necessary to assess the impacts of doing the offload process.
Intel Advisor is here to help you with such a pre-assessment via its Offload Modeling perspective.
Using Offload Modeling, you can estimate which parts of your code will be beneficial to offload; it lets you predict the performance gain if your CPU-run application is offloaded to a GPU. Not only that, if your OpenCL, SYCL, or OpenMP target application is originally running on a GPU, you can determine the potential pros/cons of offloading it to a different target device.
GPU offload compute is the most efficient when it can work on a well-defined dataset accessible locally in the GPUs address space. However, there will be the need to export data to and from the CPU. How to time and group those data transfers for best parallel execution performance can be a key aspect of your application’s threading model design.
Intel Advisor can point out which parts of your application are limited by L3 cache or memory bandwidth constraints and which ones are potentially impacted by transfer frequency. Thus, it allows you to make code design decisions for heterogeneous compute that mitigate this as best as possible.
Have a look at a model offloading summary generated by Intel Advisor:

Figure 6. Sample Model Offloading Summary
→ Check out this link on how to model GPU offloading with Intel Advisor.
Explore Threading Designs
Adding parallelism to your existing serial application flow enables you to leverage the processing capabilities of multiple cores to get better and quicker results. However, you may encounter several issues while attempting to achieve an efficient parallel execution across the architecture. For instance, incorrect outcomes and unpredictable crashes are probable results of incorrect task interactions.
If your serial code originally does not allow parallel execution but you attempt to add parallelism to it, you may have to deal with unexpected errors. Hence, a considerable amount of analysis is required to gain the best possible improvements by adding parallelism to a program.
To accomplish this, Intel Advisor lets you explore multiple threading models such as OpenMP and Intel® oneAPI Threading Building Blocks (oneTBB) for your serial program so that you can assess the performance impact of each before implementing it. Called “Threading Summary, this capability:
- Allows you to estimate the results of scaling your application on systems with more cores and eliminate data-sharing issues well in advance.
- Recommends ways to optimize the overall application performance by examining the outcomes of each threading option.
- Gives you information about which loops/functions should be parallelized for the highest performance gain.
A threading summary generated by the Intel Advisor appears as follows:

Figure 7. Sample Threading Summary
→ Visit this link to know more about modeling threading designs with Intel Advisor.
What’s Next?
In addition to the above four ways Intel Advisor helps you design and optimize performant applications, the tool also facilitates features such as code annotations, designing dependency flow graphs, and analyzing MPI applications.
Get started with Intel Advisor: Explore all its functionalities and confidently build an efficient and high-performance application today.
Once you have carefully designed your application with Intel Advisor, we also encourage you to know about Intel® VTune™ Profiler; another amazing tool for fine-tuning your application performance. Dive deeper into this tool through our VTune Profiler Training Video Series on YouTube, Leverage it for threading analysis, GPU offload analysis, troubleshoot memory concerns, and a lot more.
Get The Software
Install Intel Advisor as a part of the Intel® oneAPI Base Toolkit or download its stand-alone version (both are free).
Additionally, you may have the opportunity to build and test your application using oneAPI tools across accelerated Intel CPUs and GPUs on the beta version of Intel® Developer Cloud. We also encourage you to check out other AI, HPC, and Rendering tools in Intel’s oneAPI-powered software portfolio.
Useful Resources
Following are the links to explore about the Intel Advisor tool in detail:
Acknowledgements
We would like to thank Chandan Damannagari, Cory Levels and Jennifer Dimatteo for their contributions to this blog.