Author: Lingyun Cai, Intel
Co-Authors: Hong Zheng, Zheda Chen, Prashant Kodali, Intel
ARC++ (Android runtime for Chrome), which is the vehicle to run Android apps on Chrome OS, is an important usage on Chrome OS. As Android community puts higher priority to performance optimization for the Advanced RISC Machine architecture platform due to its dominant position in the market, it is really hard for Intel Architecture (IA) to drive platform differentiated optimization to win the competition against the Advanced RISC Machine architecture competitor on ARC++ usage. In order to tackle the above challenges, in this paper, we’ve analyzed the performance issues, compared the platform differences, and leveraged compiler technologies, including ThinLTO, AutoFDO and Native Function Layout, to deliver platform differentiated optimizations by mitigating the platform limitations such as improving native code locality and reducing the stall instruction cycles. As a result, our experiments show that ARC++ Web performance on IA platform can be improved by ~10% in current stage and the gap against competitor can be closed by ~5%.
Introduction
Chrome OS is an operating system that is designed based on the Linux kernel and uses the Chrome browser as its principal user interface. Chrome OS primarily supports web apps, with an integrated media player and file manager. Chrome OS is also capable of running Android apps by utilizing ARC++, which is the current method for booting Android in a container under Chrome. With ARC++ support, Chrome OS users are provided with Play Store Android apps without developer action, which enlarges Chrome OS
usages from web apps only to additional Android apps.
AsARC++ is such an important usageon Chrome OS and web browsing is one of the most common usages, its performance is critical to user experience. WebView is the system component powered by Chrome, and it allows Android apps to display web content inside ARC++. Unfortunately, the performance of WebView, especially competition performance, is not as good as we’ve expected on Atom-based platforms. Compared with the Advanced RISC Machine architecture competitor, ARC++ WebView on our platform shows much worse performance, which is a severe competition threat for current and future IA platforms.
In order to address the threat through our optimization work, we’ve started deep analysis for ARC++ WebView performance issue and made the following contributions:
Overcoming software environment restriction. System WebView is built-in within ARC++ and can’t be uninstalled. Besides, benchmarks for performance measuring are complicated. Our
“proxy” approach of using equivalent Chrome browser makes it easier to analyze.
Improving general performance issues in multiple browser components. The performance gap disperses in lots of browser components, such as V8, Blink, CC and Skia. This paper presents new optimization techniques, making the performance improvement general and common.
Mitigating software tool limitations. Profiling tool like Intel VTune Amplifier is very beneficial to performance analysis. However, there is a great lack of similar tools on the Advanced RISC Machine architecture platform for fair comparison. Besides, the time measurement for functions with pretty short execution time also has limitations on our competitor. We creatively transformed the competitive analysis to comparative analysis on IA platform, which walkarounds the software tool limitations effectively.
In addition to those contributions, we also effectively addressed the concerns from community, thus successfully influenced them to improve Android/ARC++ performance for IA platforms with differentiation, although the Advanced RISC Machine architecture dominates the Android market and has much higher priority in community currently.
In this paper, we’ll introduce how we achieve the above-mentioned contributions through performance analysis on ARC++ WebView, and how we mitigate IA platform limitations to deliver differentiated performance improvements by leveraging compiler technology, such as ThinLTO (Thin Link Time Optimization), AutoFDO (Auto Feedback-Directed Optimization) and Native Function Layout.
Body
In this chapter, we’ll share our analysis method for ARC++ WebView performance and our optimization proposals in detail. The devices used for ARC++ WebView performance analysis and evaluation are Acer® ChromeBook Spin 11 (Electro) as Atom-based IA platform and Acer® ChromeBook R13 (Elm) as the Advanced RISC Machine architecture competitor. To clarify, in our paper, we would use competitor to refer to the Advanced RISC Machine architecture competitor for simplicity
Analysis
During our performance tracking for ARC++ WebView performance, large performance gaps were observed between our Atom-based platform Electro and competitor Elm on multiple benchmarks, especially CanvasMark [1], where 17% performance gap existed between Electro and Elm. We analyzed the performance issue through methods like case simplification, platform profiling and proxy analysis, and details are described in this section below.
As system WebView is built-in within ARC++, it can’t be uninstalled and is impossible to debug. Instead, we used Chromium as the browser proxy for system WebView. On one hand, Chromium shares the basic code base as WebView but is much easier for debugging. On the other hand, we had similar performance observations using Chromium, shown as Figure 1 below
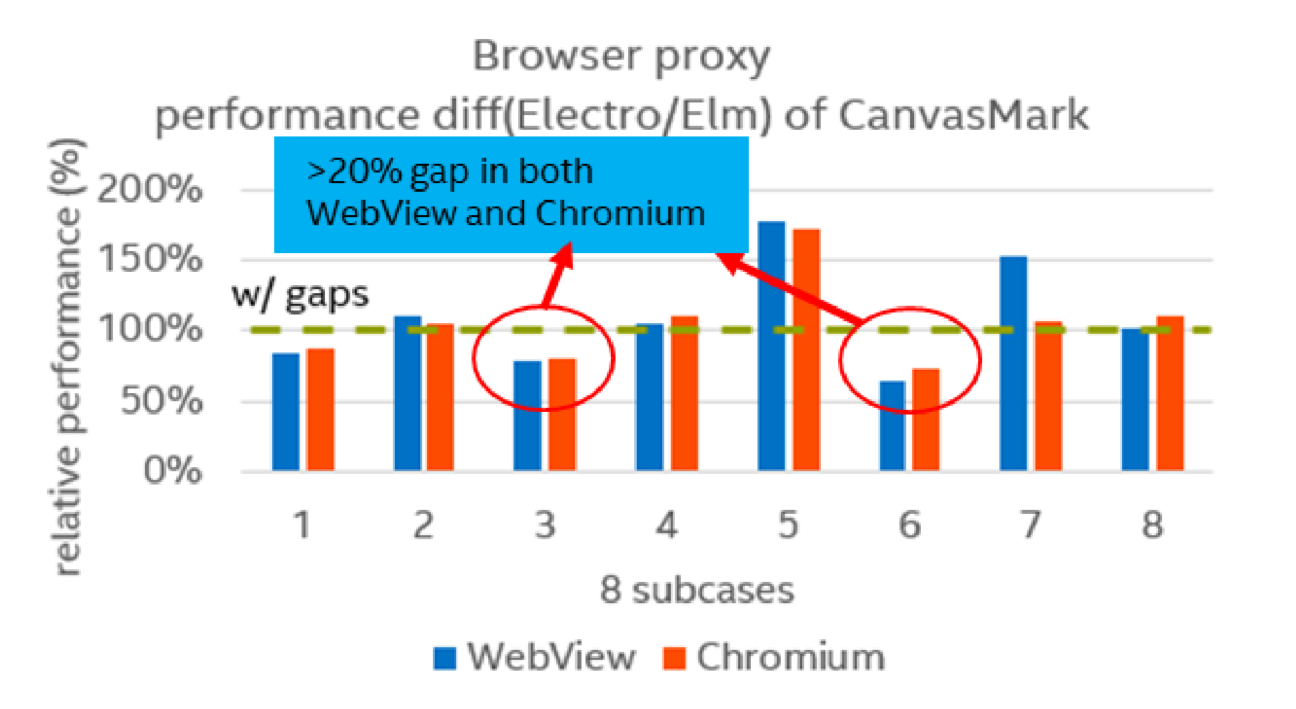
Figure 1. Performance difference of CanvasMark using WebView and Chromium
Compared with Elm, Electro was ~25% lower in instructions per cycle based on Linux perf tool. We conducted a preliminary analysis using Chrome tracing, which would record C++ or JavaScript functions in a hierarchical view for each thread in each process. For our performance issue, render main thread was the bottleneck on Electro, which was ~35% slower over Elm. Furthermore, we observed performance gap existed in multiple components dispersedly, such as V8, Blink, CC and Skia, presented in Figure 2
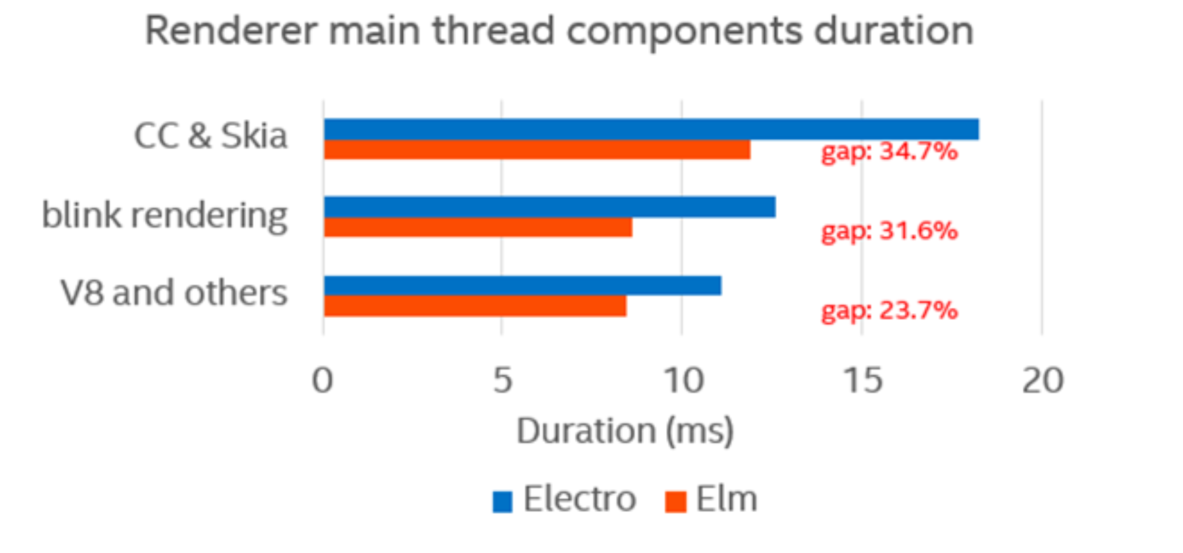
Figure 2. Gap distributions on render main thread
As we’ve excluded the impacts from CPU and Memory perspectives mentioned above, we needed deeper profiling to seek more clues. Profiling tool like Intel VTune Amplifier is quite useful for performance analysis in micro-architecture level, however, we didn’t have similar tools on competitor platform for fair comparison. Besides, as breakdown went deeper and hotspot functions became smaller, Chrome tracing would introduce large overhead to time measurement, compared with the execution time of the function itself. Using timestamp on Electro would bypass the issue, while the timestamp measurement on Elm was not accurate. In order to overcome such profiling tools limitations, we searched other analysis approaches and tried to compare the performance between ARC++ and pure Android system. For Electro, we managed to boot the Android system on the same device as Chrome OS ARC++, so SoC and other hardware configurations were identical. For Elm, we measured the Android performance on an Android device with same SoC. Figure 3 shows the detailed results.
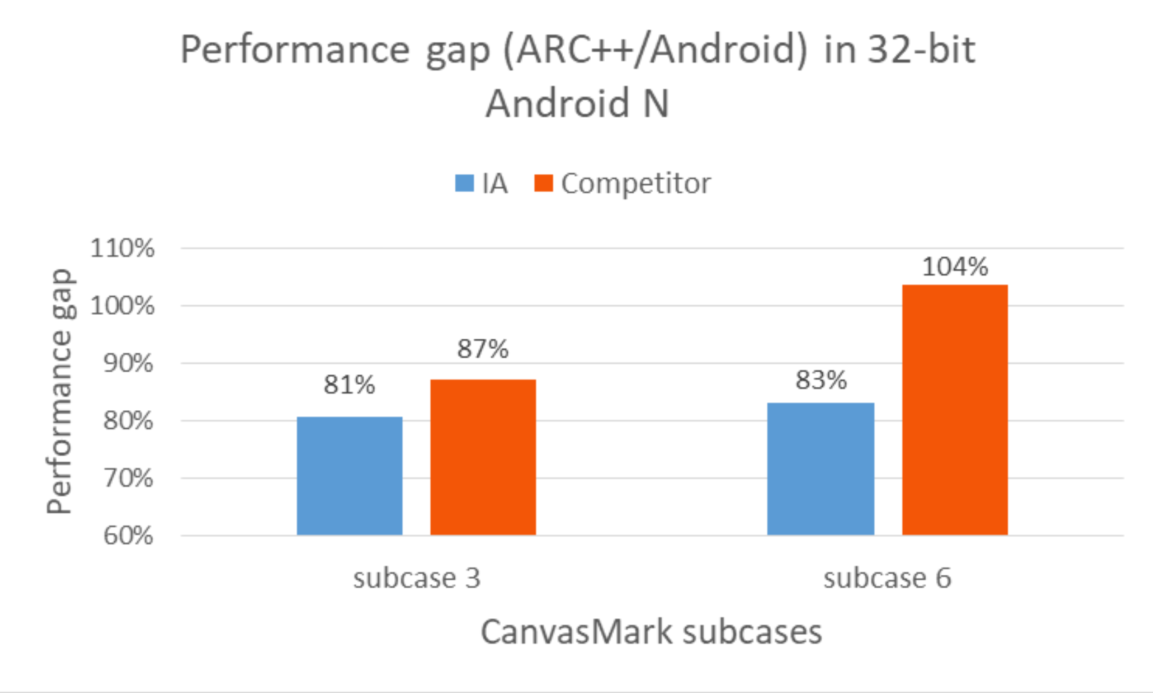
Figure 3. Performance gap between ARC++ and Android
From Figure 3, we could see significant ARC++ vs. Android gap on IA, but less gap on competitor. Inspired by the data, we shifted our analysis approach to use ARC++ vs. Android on IA Electro as proxy for IA vs.competitor ARC++ to mitigate such tools limitations.
Profiling data on ARC++ and Android indicated ~22% higher icache misses on ARC++ (66.8% of clockticks) than that on Android (44.5% of clockticks). In order to verify the icache misses issue, we tried to breakdown the ARC++ vs. Android gap into below 7 major hotspot functions and did experiment within them.
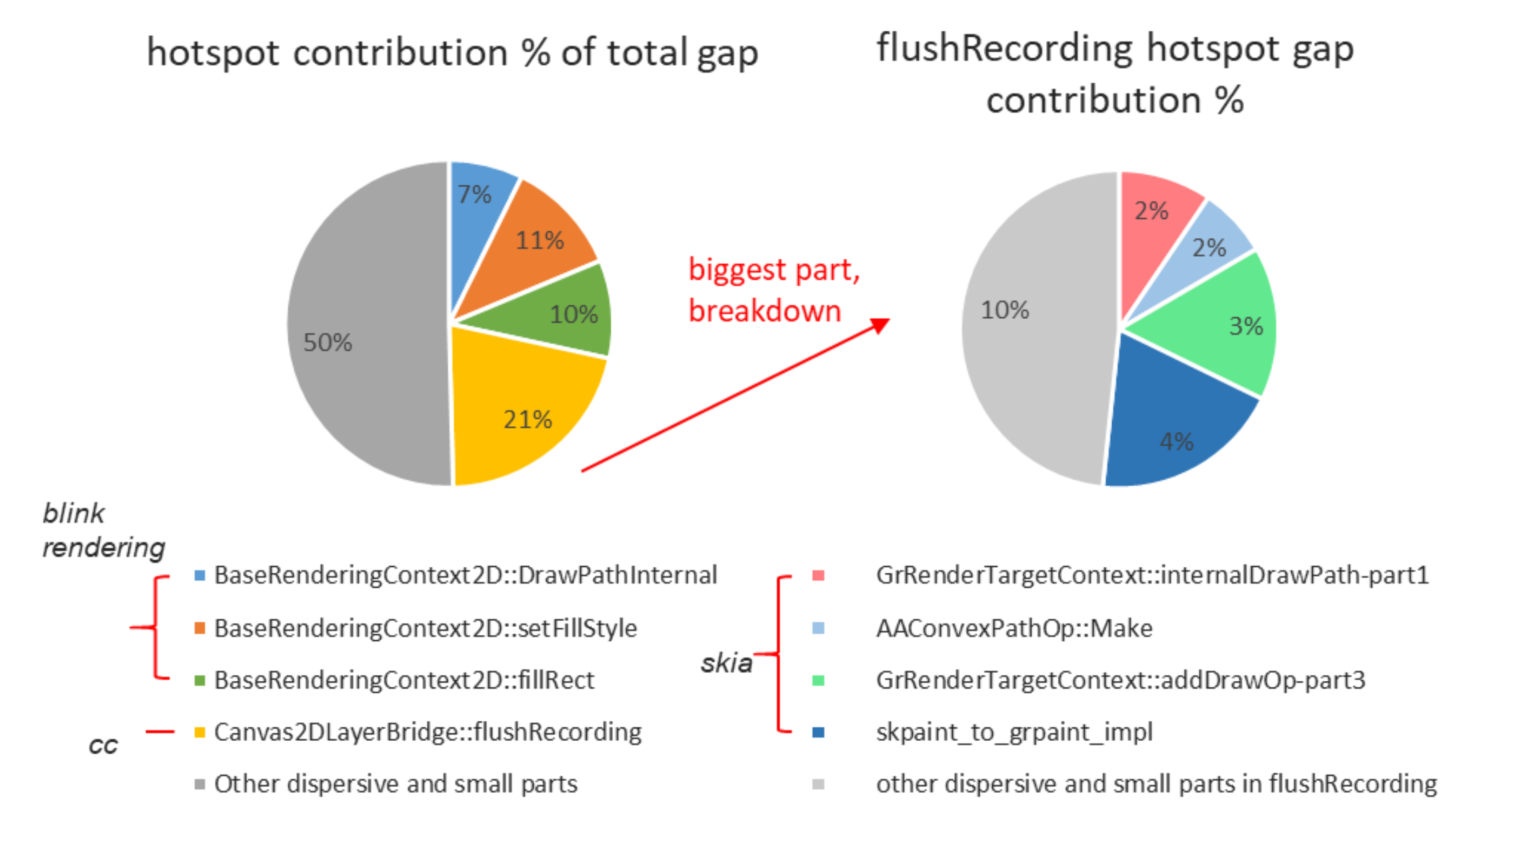
Figure 4. Hotspot functions contributed to total ARC++ vs. Android gap
The experiment we designed was to break down above 7 hotspots into several small functions and compare the time between two rounds of function executions. Two rounds of function executions were guaranteed to do exactly the same things by checking the consistency of assembly code. The pseudo code for experiment is illustrated in Figure 5 below
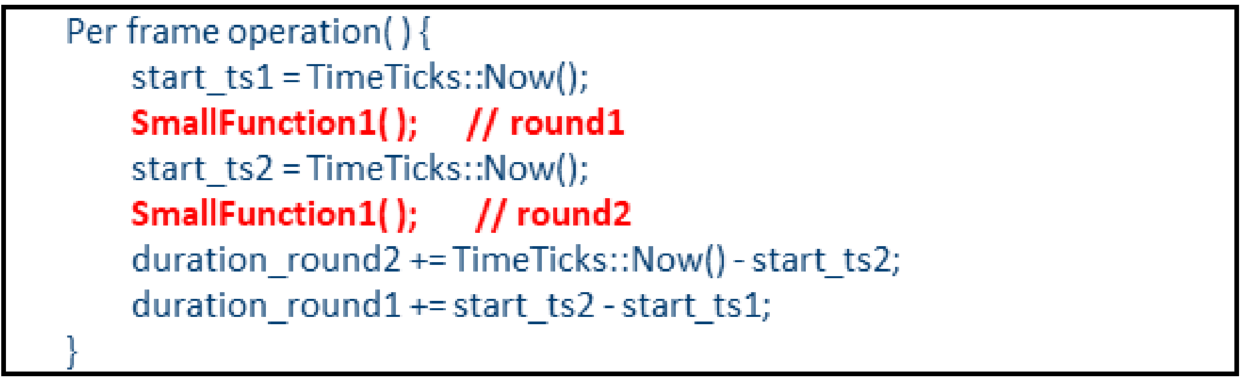
Figure 5. Pseudo code for icache misses experiment
The results are presented in Figure 6(a), which shows the performance gaps of two rounds function executions, calculated as ARC++ and Android performance delta divided by ARC++ performance. We could see distinct ARC++ vs. Android gap for first round SmallFunction1 run time, but almost no gap for second round run time, which were observed as the common issue in all 7 hotspots. Basically, we identified several patterns in hotspots that suffered from icache misses problems, such as memory allocation, virtual function, hash table operation and large amounts of conditional logic, but not limited to these.
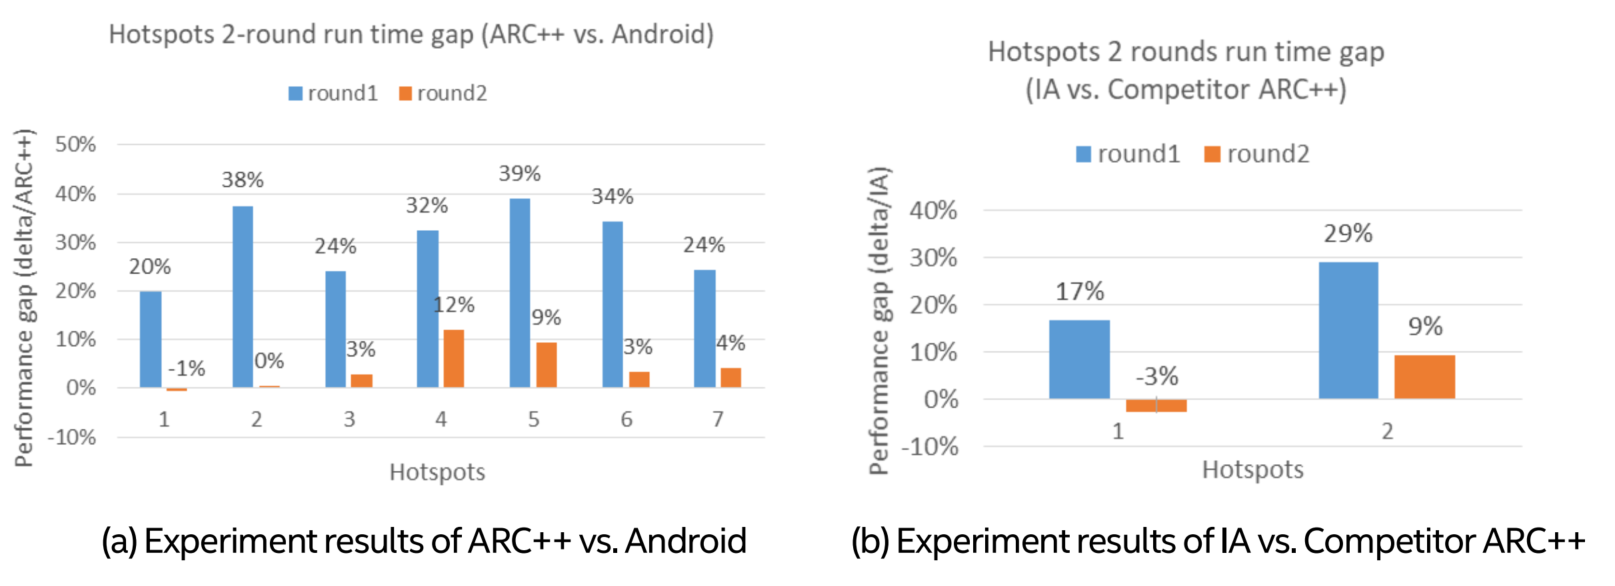
Figure 6. Experiment results for icache misses issue verification
We also re-verified the icache misses issue by conducting above experiment between IA and competitor ARC++. As timestamp was extremely inaccurate due to resolution issue on Elm ARC++, we could only use Chrome tracing as an imperfect workaround to view the trend, although overhead existed. We randomly picked up 2 functions out of 7 and the results were presented in Figure 6(b). Similar observations were shown that big gap existed in the first round run time, while small gap in the second round run time.
Based on all the analysis and experiments above, one major suspect for the performance gap on ARC++ WebView is due to the limitation of high icache misses on Atom-based platform.
Optimizations
As stated in section 2.1, high icache misses (66.8% of overall cycles) is one major suspect of bad ARC++ performance on IA platform. In order to improve native code locality and reduce the stall instruction cycles, we’ve explored and proposed to leverage compiler technology to optimize code generation and mitigate such platform limitations. As our Atom-based platform has smaller instruction cache and suffered from icache misses issue more badly when compared to competitor platform, these optimizations are expected to benefit more for our platform. This section details the methodologies and solutions we’ve applied.
A. ThinLTO
LTO (Link Time Optimization) is a method for achieving better runtime performance through wholeprogram analysis and cross-module optimization [2]. During the compile phase, clang will emit LLVM bitcode instead of an object file, then all these bitcode files will be merged into one monolithic Module. After applying some compiler optimizations like inlining, the compiler would produce the final binary. LTO would help to boost the binary performance, since it removes module optimization boundaries via crossmodule optimization. However, it’s also slow, not friendly with incremental build and requires a large amount of memory due to the merge of all bitcode files into one single Module. The design schematic is presented as Figure 7(a).
ThinLTO is proposed by T. Johnson etc. to resolve the above-mentioned limitations of LTO while retain most of the performance achievement [2]. Instead of loading the bitcode and merging a single monolithic module to perform these analyses, it generates bitcode as LTO, but extended with module summaries.
Then the Thin Link layer combines these summaries and performs global analysis. At last, parallel backends conduct summary-based importing and optimizations. The process is much more light-weight, parallel and memory friendly, illustrated as Figure 7(b).
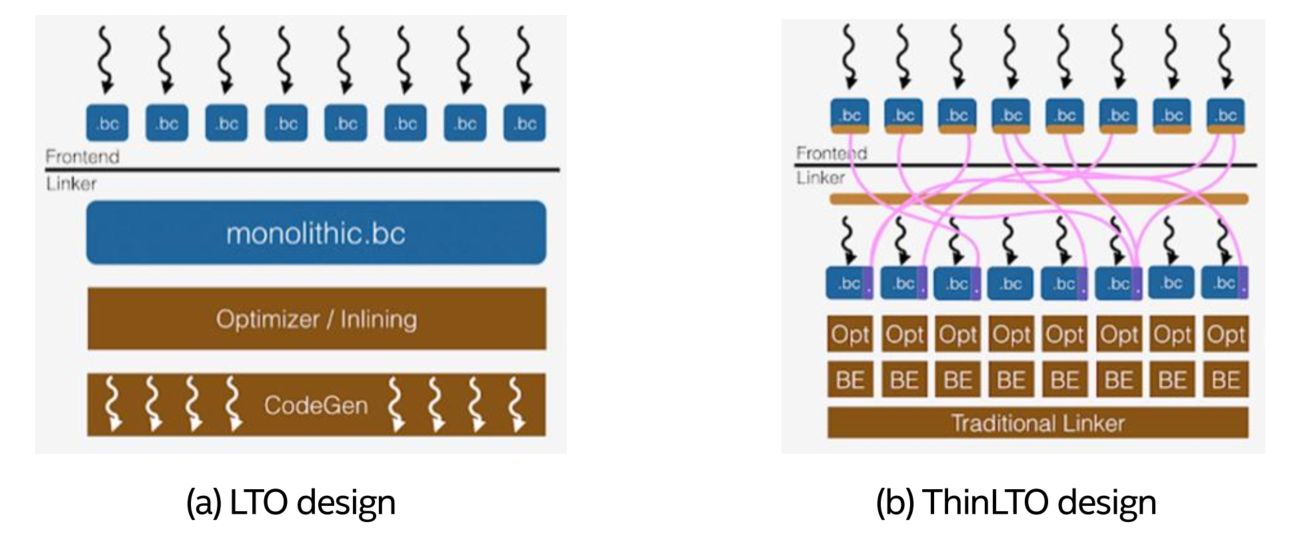
Figure 7. The design of LTO and ThinLTO [2]
B. Enhanced AutoFDO
AutoFDO is a system to simplify real-world deployment of feedback-directed optimization (FDO). The system works by sampling hardware performance events on production machines and using those profiles to guide optimization [3].
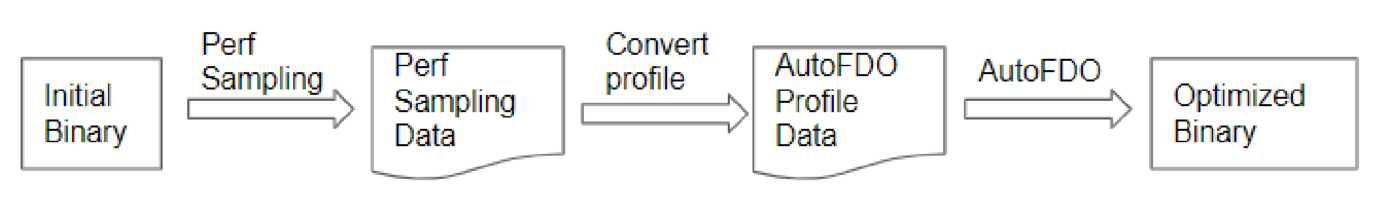
Figure 8. AutoFDO general pipeline
The general pipeline is shown in Figure 8. The 1st step is to use perf tool to capture hardware event sampling when running benchmarks. LBR (Last Branch Records) event is utilized because it can help build a near-accurate instruction frequency profile [4]. The 2nd step is to convert perf sampling data to AutoFDO profile data, which contains the function call related information, e.g. call counts, and function address, size etc. The 3rd step is to re-compile the application by feeding the AutoFDO profile to compiler, and generate an optimized application binary.
Currently, AutoFDO for Chrome mainly focuses on page loading and JavaScript benchmarks. However, rendering performance like HTML5 canvas rendering can be barely improved by AutoFDO optimization. Thus, we proposed to add representative HTML5 canvas benchmarks, rendering_desktop, into the current AutoFDO pipeline to improve HTML5 canvas performance and enlarge AutoFDO benefits to more web performance aspects.
C. Native Function Layout
Native Function Layout is also a profiling-based optimization approach. The general pipeline is shows in Figure 9. It follows the same principle behind AutoFDO using sample-based profiling data collected from un-instrumented binary running in production, but differs in the method of processing profile data.
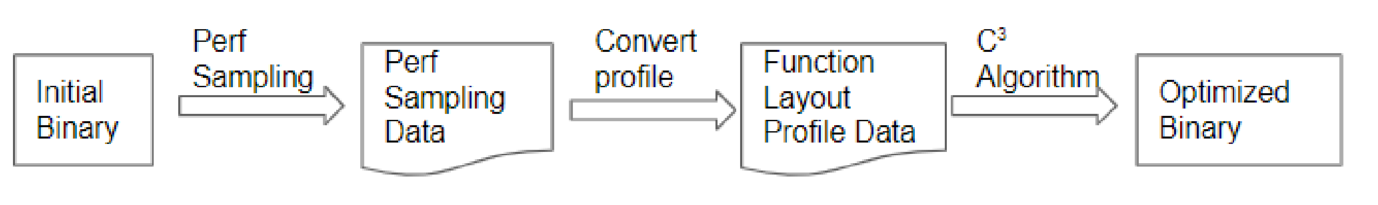
Figure 9. Native Function Layout general pipeline
By default, the linker places functions according to the order of the object files specified in the command line, with no particular order within each object file. This arbitrary layout disperses the hot code across the text section, which reduces the efficiency of caches and TLBs [5]. Different from AutoFDO, Native Function Layout focuses on optimizations of function placement. The used function layout algorithm is named C3 (brief of Call-Chain Clustering) and introduced by Ottoni etc. It’s a call-graph-based method, which would take caller/callee relationships into accountto optimize function placement.LBR event sampling is still used as it can produce call graphs from the hardware LBR registers. This method could reuse AutoFDO pipeline (i.e., sampling benchmarks and data) but achieve slightly better performance than using AutoFDO alone.
Currently, C3 algorithm has two ways of implementation. One is the open-source tool called hfsort [5], and the other is called lld-C3, which is integrated inside lld linker. As Chrome uses lld as its default linker, and lld-C3 also has ~0.6% better performance gain, we select the lld-C3 implementation for our optimization.
Native Function Layout optimization is not available for now on competitor platform due to lack of compiler toolchain readiness, which could bring extra performance gain and well help to reduce competition gaps for our platform.
Results
In this chapter, we detail the experiments and corresponding performance evaluations of our optimizations on ARC++ WebView. Two benchmarks are utilized for evaluation, i.e., Speedometer2 [6] for JavaScript and CanvasMark for rendering performance.
ThinLTO evaluation
Configuration tuning
As binary size impact is an important concern on Android Chrome upstream when delivering optimizations, and ARC++ shares the same binary as Android, the impact of optimizations to binary size is also our primary concern for evaluation. The main keys for tuning the size of a ThinLTO binary seem to be optimization levels (-O0, -O1, etc.) and function import thresholds. The latter is tunable by passing ‘-Wl,- mllvm,-import-instr-limit=$N’to the linker, where N is a positive integer.Usually,thesmaller N is, the smaller the binary will be, but the fewer optimization opportunities we’ll have. Figure 10 illustrates the binary size and performance changes with regard to the optimization level and function import thresholds on Electro ARC++, where the default binary without ThinLTO optimization was used as baseline for comparison.
From Figure 10(a) we can see enabling ThinLTO could help to reduce the binary size on our platform in general. Optimization level -O2 and -O3 had similar impacts. As the value of function import threshold increased, the binary size was increased, where setting N=5 achieved the largest binary size reduction. Figure 10(b) presents the performance changes with different configurations. With optimization level -O2 and function import threshold set to 25, binary size could have a relatively large reduction while both peedometer2 (~11%) and CanvasMark (~8%) could have the largest performance boost from ThinLTO.
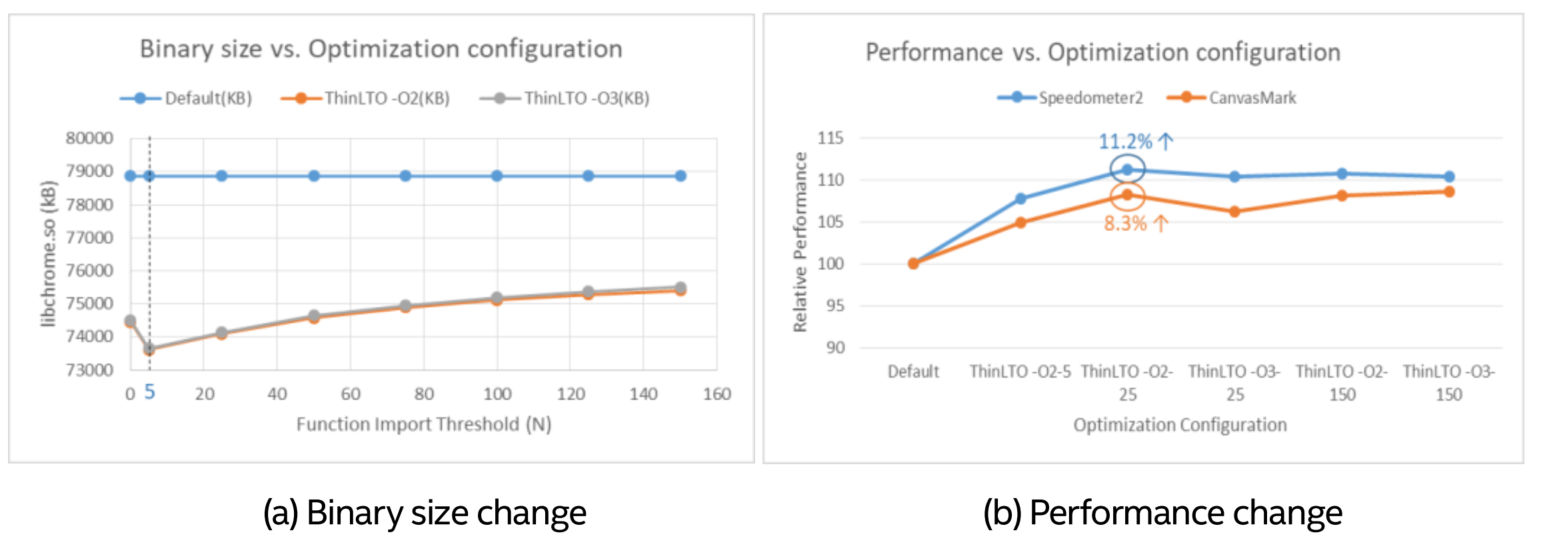
Figure 10. Binary size and performance impact evaluation on Electro ARC++
However, situations on competitor platform were different. According to the evaluation from Chrome upstream, setting function import threshold to 25 or above increased the binary size, which was even larger than default one. Only threshold set as 5 could reduce the binary size while bring performance gain.
After several discussions, the first stage of ThinLTO optimization would use configurations as optimization level -O2 and function import threshold 5, which is a trade-off between binary size and performance for the binary size increase issue on competitor platform. In second stage, we’d like to fine tune the configurations for our platform specifically to gain more benefits from ThinLTO optimization.
Performance evaluation
As ThinLTO configurations ‘-O2/-5’ are selected as the default value for its first-stage optimization, we evaluated its performance impact on both Electro and Elm ARC++ WebView based on these configurations, with details shown in Figure 11.
The performance of WebView binary without applying ThinLTO optimization was used as baseline. From Figure 11 we can observe performance boost of both Speedometer2 (~8%) and CanvasMark (~4%) on Electro ARC++ by ThinLTO. Moreover, ThinLTO can benefit more on Electro over competitor Elm in general, which demonstrated platform differentiations and reduced competition gaps. As for the icache misses perspective, we could observe 3~4% reduction as well.
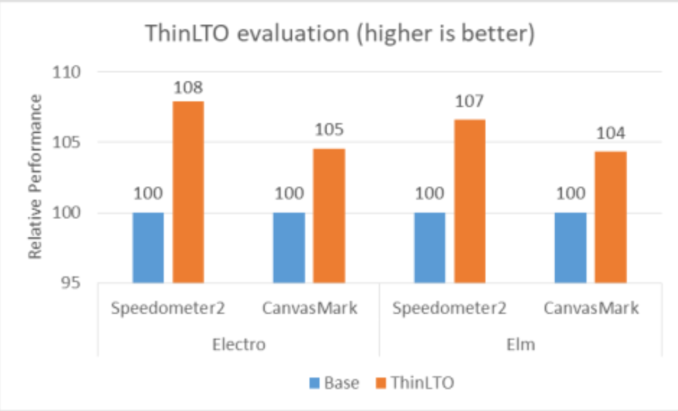
Figure 11. Performance evaluation for ThinLTO
Enhanced AutoFDO evaluation
Benchmark selection
The purpose of enhanced AutoFDO is to enlarge coverage of current AutoFDO to benefit the performance on more web performance aspects, such as HTML5 canvas rendering. Thus, we proposed to add a representative HTML5 canvas rendering benchmark, rendering_desktop.tough_canvas_cases, into its current benchmark set.
The benchmark rendering_desktop.tough_canvas_cases contains 36 subcases in total, which makes the AutoFDO pipeline slowed by ~15 minutes to finish. In order to reduce the overhead added to AutoFDO pipeline, we selected 18 subcases and reduced the pipeline duration by half (~8 minutes), while achieved similar performance gain for HTML5 canvas rendering performance.
Performance evaluation
We evaluated the performance impact on both Electro and Elm ARC++, and details are shown in Figure 12.
We used the performance of current AutoFDO as baseline, and we could see that Enhanced AutoFDO basically achieved similar performance as AutoFDO on JavaScript performance (Speedometer2), but improvedtheHTML5 canvas rendering performance (CanvasMark). Especially ~5% on Electro ARC++ while only ~1% on Elm ARC++, which effectively helps to close the performance gaps with our competitor.
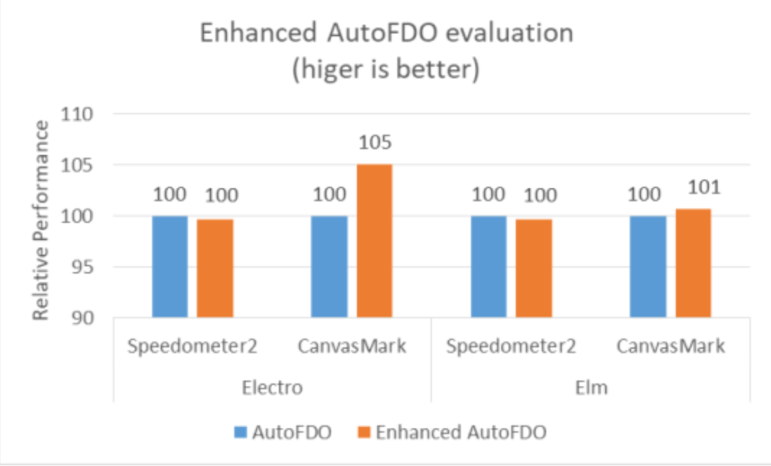
Figure 12. Performance evaluation for Enhanced AutoFDO
Native Function Layout evaluation
Native function layout method is currently not available for competitor platform due to lack of toolchain readiness, so we only evaluated the ARC++ WebView performance on IA platform (Electro). We used the performance of AutoFDO as baseline, and applied Native Function Layout on top of it for comparison. Details are shown as Figure 13, from which we could see both Speedometer2 and CanvasMark performance were improved by Native Function Layout optimization, especially ~5% improvement for CanvasMark on Electro ARC++. Besides, we also observed ~1% icache misses reduction by optimization.
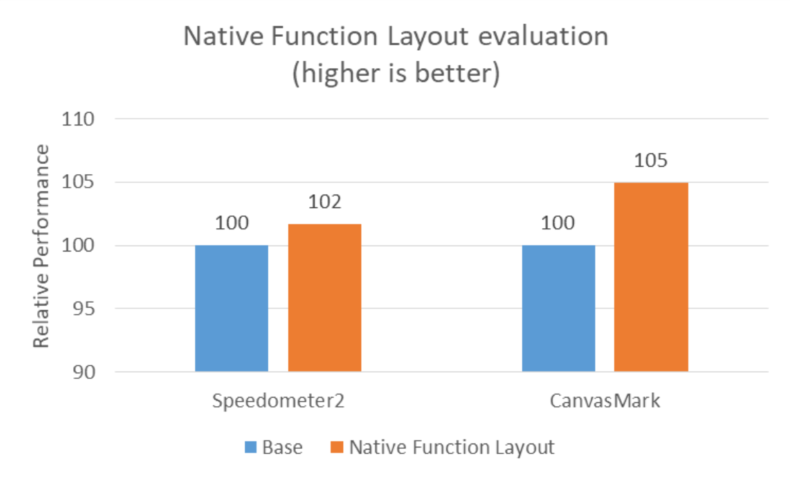
Figure 13. Performance evaluation for Native Function Layout optimization
In total, ARC++ Web performance on IA platform can be improved by ~10% in current stage and the competition gap against our competitor can be closed by ~5% through above-mentioned
optimizations using compiler technology.
Summary
ARC++ is an important usage on Chrome OS and web browsing is one of the most common usages, however, we’re confronted with severe competition threat for its WebView performance on Atom-based IA platform. Through analysis, we overcame the challenges from software environment restrictions, tools limitations and performance issue dispersion, discovered the possible cause as platform limitation of high icache misses, and managed to design effective experiments to verify it. Based on analysis results, we proposed to leverage compiler technology, such as ThinLTO, AutoFDO and Native Function Layout, to deliver platform differentiated optimizations. As a result, ARC++ Web performance on IA platform was improved by ~10% in current stage and icache misses was also reduced accordingly. More importantly, performance gap against the Advanced RISC Machine architecture competitor was closed by ~5%. More improvements are expected via our further efforts to fine tune the optimization parameters and methods.
Acknowledgments
We would like to appreciate Jaishankar Rajendran, Alwin Mathew and his team, Tianyou Li and his team, Yongnian Le and Shuangshuang Zhou for their support and guidance to our work.
References
1. CanvasMark.
2. T. Johnson, M. Amini, D. Li, ThinLTO: Scalable and Incremental LTO.
3. D. Chen, D. Li, T. Moseley, AutoFDO: Automatic Feedback-Directed Optimization for Warehouse-Scale Applications, Proceedings of the 2016 International Symposium on Code Generation and Optimization, pp. 12-23, 2016.
4. D. Chen, N. Vachharajani, R. Hundt, X. Li, S. Eranian,W. Chen, and W. Zheng,Taming hardware event samples for precise and versatile feedback directed optimizations, IEEE Transactions on Computers, 62(2):376–389, 2013.
5. G. Ottoni and B. Maher, Optimizing function placement for large-scale data-center applications, Proceedings of the 2017 International Symposium on Code Generation and Optimization, pp. 233-244, 2017.
6. Speedometer 2.0.