Performance analysis engineers know that non-uniform memory access (NUMA) can seriously impact performance and that NUMA performance analysis can be challenging.
Linux* has a NUMA observation tool: numastat. It provides information about the ratio of local versus remote memory use and the overall memory configuration of all nodes. It also includes failed allocations of local memory (displayed in the numa_miss column) and allocations of remote memory (displayed in the numa_foreign column). However, numastat only accounts for the memory allocation and does not measure the real-time memory traffic of the CPU. Users need more. But, an easy-to-use tool that lets you observe NUMA-related issues and where the NUMA bottlenecks reside doesn't exist. It's difficult to locate these issues, especially in complex server environments.
This author needed a tool that follows typical steps used in NUMA analysis and provides a good starting point to dive in and fix NUMA-related bottlenecks.
The typical steps that the author uses are:
- Find the memory-intensive applications with the poorest memory locality.
- Determine the application's node affinity.
- Explore the memory hot spots in the application and find the poorest latency.
- Determine the locality of these memory hot spots.
- Find the places in the application that access the memory hot spots, and then get a list of call chains to the code that accesses these memory hot spots.
NumaTOP is a new Linux observation tool that automates these steps. Different from numastat, it is an observation tool for characterizing runtime memory locality and analyzing processes and threads running on a NUMA system. It helps you:
- Characterize the NUMA behavior of processes and threads
- Identify where the NUMA-related performance bottlenecks reside
The tool uses performance counter-sampling technologies from Intel. It associates the performance data with Linux system runtime information to provide real-time analysis for production systems.
The following is a step-by-step example that uses NumaTOP to see how it helps you perform a NUMA analysis. Figure 1 is the NUMA topology of a two-socket platform, based on the Intel® Xeon® E5-2680 processor. A simple example program mgen demonstrates NumaTOP. This program generates guaranteed memory accesses (no LLC hit).

Figure 1
Step 1: Find Processes with the Poorest Memory Locality
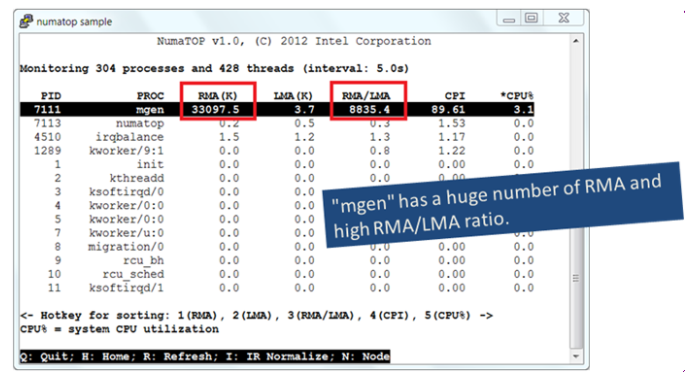
Figure 2
The process mgen is memory intensive with the poorest memory locality.
Step 2: Determine the mgen Node Affinity
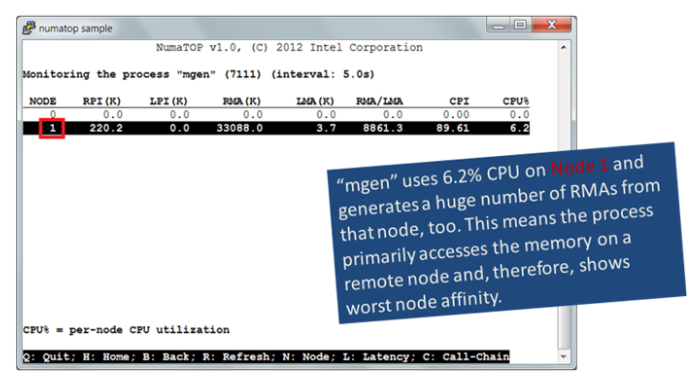
Figure 3
The process mgen is running on Node 1.
Step 3: Explore Memory Hot Spots
Find the hot spots in mgen with the poorest latency.
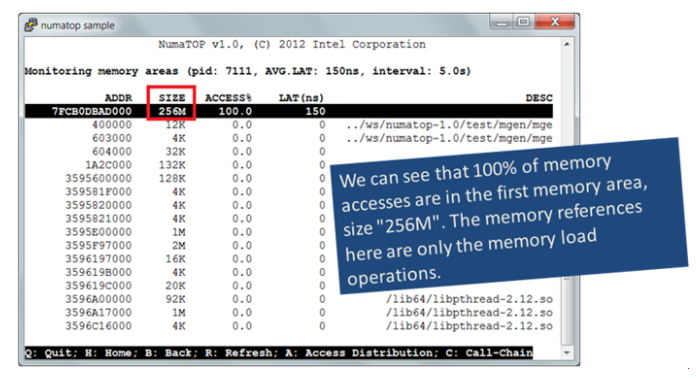
Figure 4
The mgen memory hot spot is the memory area, which is 256 MB.
Step 4: Determine the Locality
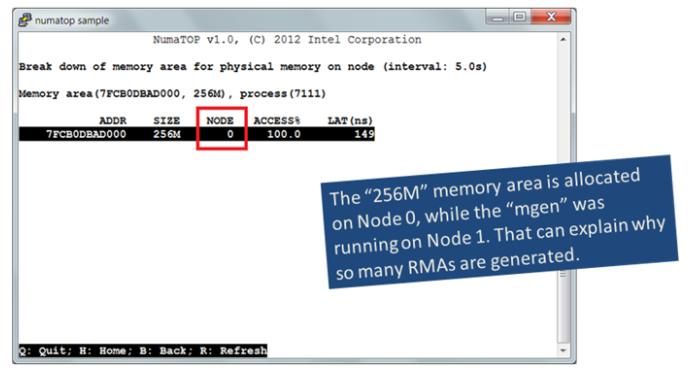
Figure 5
The memory hot spot is physically allocated on Node 0. The previous steps show how many remote memory accesses are generated. Let's go further, such as learning where in the code these accesses originate.
Step 5: What's Accessing Memory
Find the places in mgen that are accessing the memory hot spots and get a list of call chains to the code that accesses the memory hot spots.
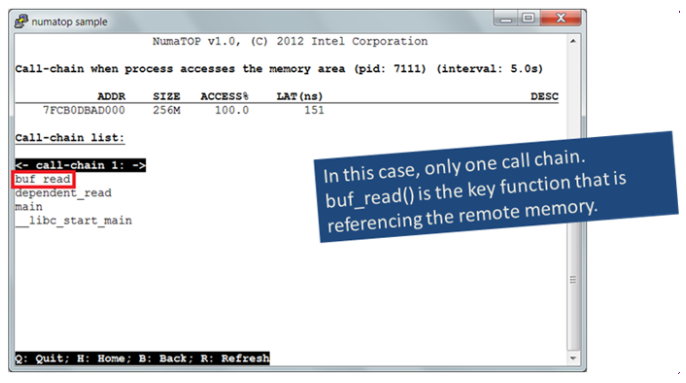
Figure 6
The buf_read() is the key function that generates a huge number of memory accesses, showing how the memory was originally allocated to improve the mgen locality and overall performance.
NumaTOP can help you find out what you want to know about NUMA bottlenecks.