In the previous article, Reduction Operations in Data Parallel C++, we explored a number of kernels to reduce an array of 10 million elements into a single value using the summation operator. In this article, we will introduce one more reduction technique, called multi-block interleaved reduction. We compare all of these reduction operations using Intel® VTune™ Profiler on both 9th generation and 12th generation Intel® GPUs and explain the reasons for performance differences among these kernels.
Multi-Block Interleaved Reduction
Data Parallel C++ (DPC++) defines short vectors as basic data types with operations like load/store and arithmetic operators defined. These short vector data types can be used to add another level of blocking to get the compiler to generate very long vector operations for architectures that can support them. We use the vec<int, 8> data type, which is a vector of eight integers, to implement the reduction operation shown pictorially in Figure 1. The access pattern shown in the illustration has a vector size of two and a sub-group size of four, with each workitem processing four elements of the input vector.

Figure 1. Load a vector of elements, do vector reduction operations
on them, and then reduce the final resulting vector.
The following code implements the reduction operation with the memory access pattern described above, using a vector size of eight and a sub-group size of 16, with each work-item processing 256 elements of the input vector:
This kernel can be encoded in a different manner by utilizing the vector load operations instead of explicitly computing the addresses. There is also a small change in dealing with the vector loaded by each work-item to reduce it first locally. (The access pattern for this implementation is shown in Figure 2.)

Figure 2. Load a vector of elements, reduce the vector to a single result, and then do the reduction.
Performance Analysis of the Reduction Kernels
To evaluate the performance of these kernels, we ran them on two different Intel GPUs:
- Intel® HD Graphics 630 (9th generation integrated graphics). This GPU has 24 execution units (EUs) with seven threads each.
- Intel® Iris® Xe graphics (12th generation integrated graphics). This GPU has 96 EUs with seven threads each.
We used VTune Profiler to analyze the performance of the kernels. Also, larger reductions (i.e., 512 million elements instead of 10 million) were performed so that the kernels run long enough to collect good profiling data. The performance of each kernel is shown in Table 1. These kernels were each run 16 times, and the average performance was recorded. The Intel® oneAPI Base Toolkit (v2021.2.0) was used to collect the data in this article.
| Kernel | Intel HD Graphics 630 | Intel Iris Xe Graphics |
|
reductionAtomics1 |
146 | 49 |
| reductionAtomics2 | 258 | 141 |
| reductionAtomics3 | 111 | 38 |
| Tree reduction | 288 | 115 |
| Built-in reduction operator | 429 | 162 |
| multiblockinterleavedreduction | 83 | 37 |
| multiblockinterleavedreductionVector | 67 | 34 |
Table 1. Performance of different reduction implementations (time in milliseconds).
reductionAtomics1
This kernel is limited by the number of atomic updates that can be performed by the hardware (Figure 3).
![]()
Figure 3. Statistics for reductionAtomics1 on Intel Iris Xe graphics.
Here, the Global Work Size column gives the total work items in this kernel, which is the size of the problem (i.e., 512 million elements). The Instance column is the number of times the kernel is called, 17 in this case. The SIMD Width column is 32, the vector size that the compiler chose for this kernel. The Computing Threads Started column shows the actual number of independent threads that this kernel executed. It is equal to the Global Work Size divided by the SIMD Width and then multiplied by the Instance count. Lastly, the GPU Atomics column gives the total number of atomic operations executed by this kernel. For the reductionAtomics1 kernel, it is twice the number of threads because each thread issues two atomic operations (a SIMD32 in Gen12 is encoded as two SIMD16 instructions).
VTune Profiler’s annotated architecture diagram shows that the 9th generation Intel GPU has significant headroom in terms of memory bandwidth (reductionAtomics1 only achieves 15.3GB/s of the 32GB/s peak) (Figure 4). The same kernel on the 12th generation GPU achieves much higher memory bandwidth because Intel Iris Xe graphics can handle more atomic memory updates than the 9th generation Intel HD Graphics (Figure 5).

Figure 4. Architecture diagram of reductionAtomics1 on Intel HD Graphics 630.
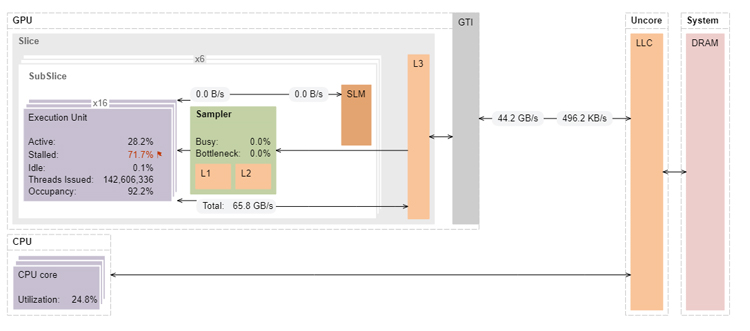
Figure 5. Architecture diagram of reductionAtomics1 on Intel Iris Xe graphics.
reductionAtomics2
This kernel performs quite poorly on both the 9th generation and 12th generation GPUs. The memory access pattern in this kernel results in the compiler generating a vector load instruction that only accesses one element of 16 different cache lines at a time. This results in the first access incurring 16 cache misses with long latency, while all other 15 references will hit in the cache. This is a good cache hit rate and bandwidth from L3, but overall performance is limited by the latency of the first memory reference, which incurs 16 cache misses. It can be seen that the cache miss rate is very low and the L3 memory bandwidth is high when compared to reductionAtomics1, but its overall performance is quite poor on both the platforms (Figure 6).
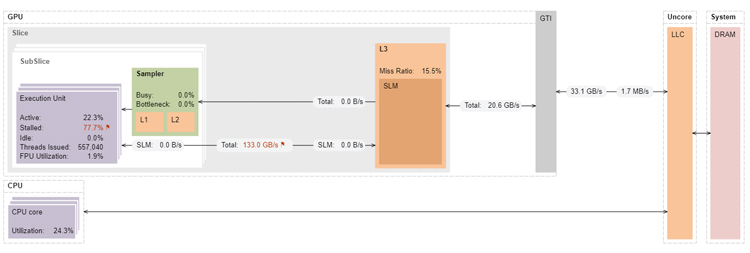
Figure 6. Architecture diagram of reductionAtomics2 on Intel HD Graphics 630.
reductionAtomics3
The memory access pattern in this kernel is such that the vector load instruction loads all the elements of one cache line at a time. This results in 100% cache misses. Even though the cache miss rate is 100%, the latency is better tolerated because multiple threads can be in flight at the same time. This can be seen from the fact that this kernel performs significantly better than reductionAtomics1 and reductionAtomics2 (Table 1), even though they have significantly lower cache miss rates (15.5% on reductionAtomics2 and 69.8% on reductionAtomics1) and lower L3 memory bandwidth (Figure 7).

Figure 7. Architecture diagram of reductionAtomic3 on Intel HD Graphics 630.
The annotated architecture diagram for reductionAtomics3 on the 12th generation GPU shows that the memory bandwidth from main memory is almost the same as the L3 bandwidth (56.5GB/s L3 BW to 58.5GB/s memory bandwidth) (Figure 8).
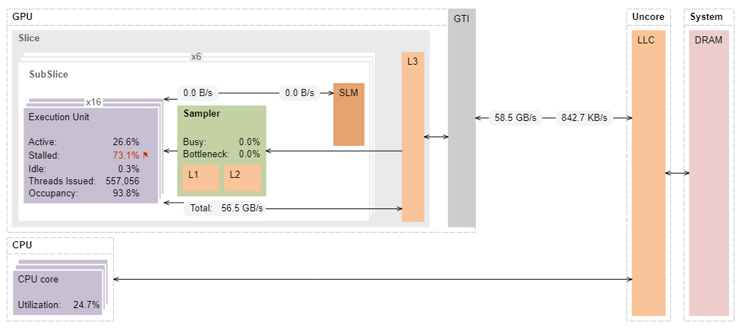
Figure 8. Architecture diagram of reductionAtomic3 on Intel Iris Xe graphics.
Tree Reduction
Tree reduction is a popular technique, but it does not perform very well on either the 9th generation or 12th generation GPU. The inherent imbalance in the algorithm—where half of the EUs are idle in each level of the reduction tree—hurts efficiency (Figure 9).
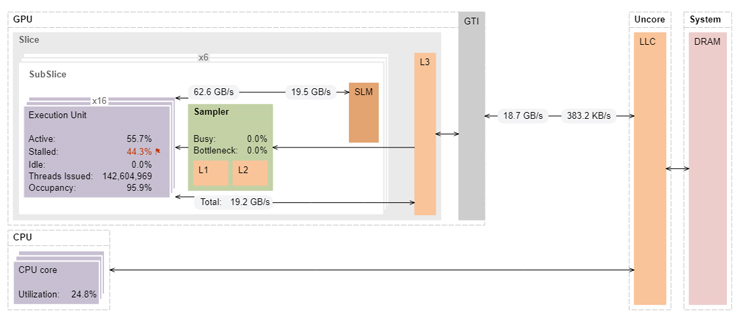
Figure 9. Architecture diagram of Tree Reduction on Intel Iris Xe graphics.
Compiler Built-In Reduction
The compiler built-in reduction operator is still under development and needs additional tuning to reach the performance of other techniques presented here. Looking at the metrics reported by VTune Profiler about the number of atomics and the number of computing threads started, and comparing them to the Tree Reduction, we can conclude that a form of tree reduction on shared local memory (SLM) is used to implement the built-in operator. It also seems that this implementation first copies data from main memory into the shared local memory before applying the reduction operator. This can be seen from the activity in the GPU Shared Local Memory lane in the VTune Profiler platform view (Figure 10).
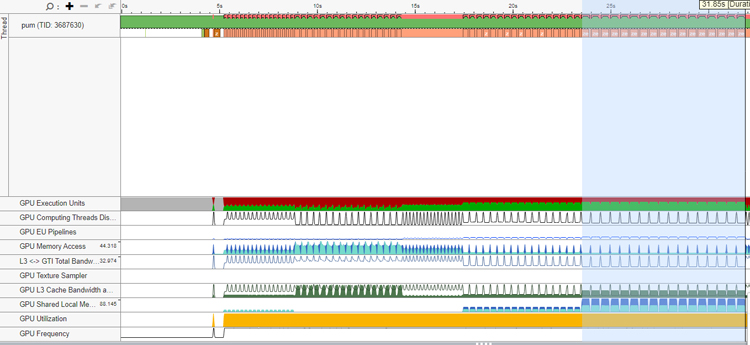
Figure 10. Platform view of the built-in reduction operator on Intel HD Graphics 630.
Comparing the architecture diagrams of Tree Reduction and the compiler built-in reduction operator, it can be seen that the usage of SLM for the latter is much higher (116GB/s vs. 62.6GB/s for read and 59.7GB/s vs. 19.5GB/s) (Figures 9 and 11). This is due to the copying of data by each thread before it is used in the reduction operation. In the Tree Reduction implementation, there is no copying of data to SLM; SLM is only used for the intermediate values that need to be produced by each work-group. Hence, our implementation of Tree Reduction performs better than the built-in operator even though they are using the same algorithm.

Figure 11. Architecture diagram of the compiler built-in reduction operator on Intel Iris Xe graphics.
It must be remembered that the performance of these reduction algorithms can vary quite a bit among architectures. The performance of the built-in reduction operator will be improved in future oneAPI compilers.
MultiBlockInterleaved
The memory access pattern in this kernel is carefully crafted so that the compiler can generate a block load operation to load 128 elements per thread, which can achieve much higher bandwidth than the other kernels (Figure 12).

Figure 12. Architecture diagram of multiblockinterleavedvector on Intel Iris Xe graphics.
he subgroup load operations in this kernel are converted by the compiler into the following four SIMD16 load instructions, where each of them populates four registers (Figure 13).

Figure 13. Assembly code generated by the compiler for the sg.load operation in the kernel.
MultiBlockInterleaved
In this final kernel, we use the DPC++ built-in vectors, which result in SIMD32 instructions, as well as block reads that give even better performance than the previous MultiBlockInterleaved kernel. The MultiBlockInterleavedVector kernel achieves peak memory bandwidth for both platforms: 32.5GB/s on the 9th generation GPU (Figure 14) and 62GB/s on the 12th generation GPU (Figure 15).
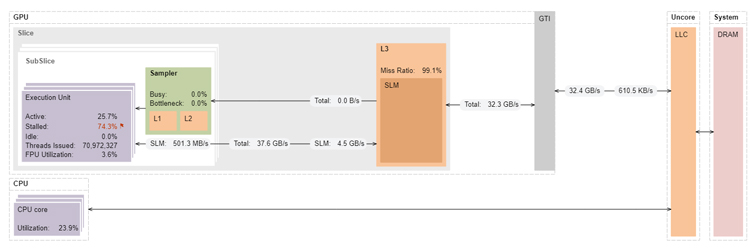
Figure 14. Architecture diagram of the MultiBlockInterleavedVector on Intel HD Graphics 630.

Figure 15. Architecture diagram of the MultiBlockInterleavedVector on Intel Iris Xe graphics.
The assembly code generated by the compiler will load 128 elements per thread. As we see below, a SIMD32 load instruction loads 128 elements into 16 registers (Figure 16). In this case, we achieve peak bandwidth to fetch data from memory into the GPU for this platform.
![]()
Figure 16. Assembly code generated by the compiler, SIMD32 vector load instruction to load 128 elements on Intel Iris Xe graphics.
Concluding Remarks
Reduction is an important operation in parallel programming and is used in many applications. In this two-part article, we showed various ways in which reduction operations can be coded in DPC++ and evaluated their performance on two integrated Intel GPUs. All the source code for the kernels used in this article are available at https://github.com/rvperi/DPCPP-Reduction.
Related Content
Using oneAPI to Speed Up the Finite-Difference Method
Read
Reduction Operations in Data Parallel C++
Read
Uncovering More Tuning Opportunities with Intel® Compiler Optimization Reports
Read
Profiling Heterogeneous Computing Performance with VTune Profiler
Watch
Top-Down Topology-Aware I/O Performance Analysis with Intel® VTune™ Profiler
Watch
Intel® oneAPI Base Toolkit
Get started with this core set of tools and libraries for developing high-performance, data-centric applications across diverse architectures.