Say hello to some of the latest improvements for the Intel® Graphics Performance Analyzers (Intel® GPA) tool suite and Intel® GPA Framework.
Graphics Frame Analyzer
Pixel History for DirectX* 12 applications
We are introducing the first iteration of the Pixel History feature for DirectX 12 frames and streams. This feature is also available for DirectX 11 and allows you to easily see how many times your game is writing to the same pixel, and what GPU events influenced the final color.
![]()
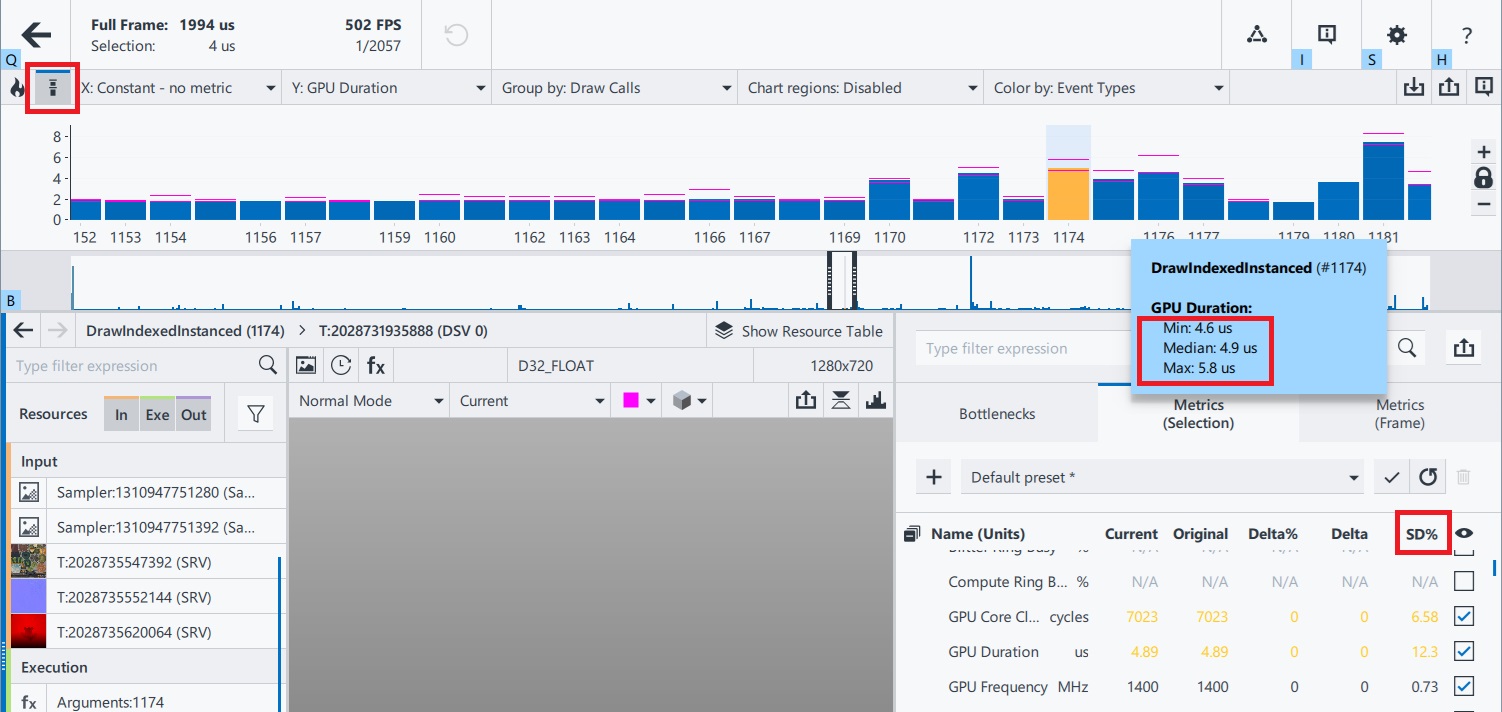
Collect fast/stable metrics
Added the Collect fast/stable metrics option that visualizes fluctuating metrics. When enabled, Graphics Frame Analyzer collects metrics over multiple runs. If the values fluctuate from run to run, the minimum, maximum and median values are displayed in the Bar Chart. The metrics with high deviation are highlighted in yellow in Metrics tab, and standard deviation values are also shown as SD%.
UI improvements
- Enabled horizontal scrolling through the bar chart using Shift + Mouse Wheel.
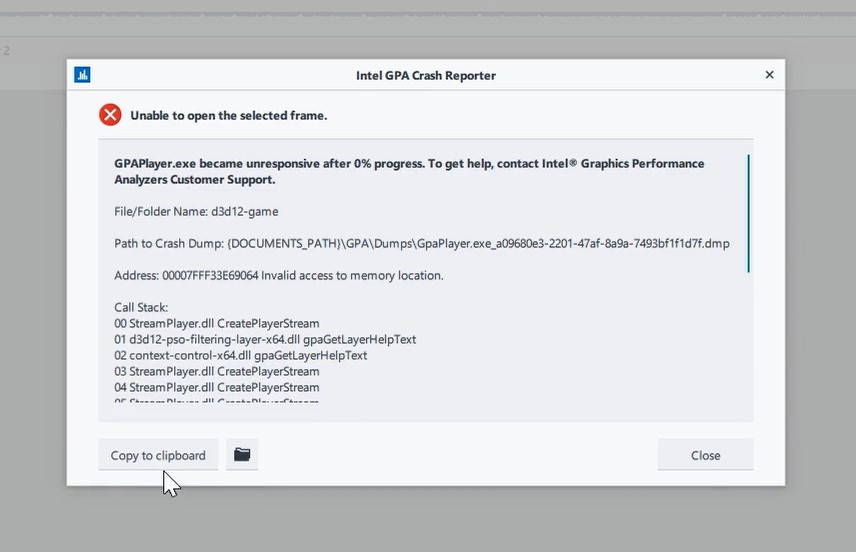
- Improved error report dialog when a stream/frame fails to open. It now includes functionality to copy the crash report and indicates the location of the crash dump. Just click this button to copy the report and the contents can be posted to our support forum.
Intel® GPA Framework
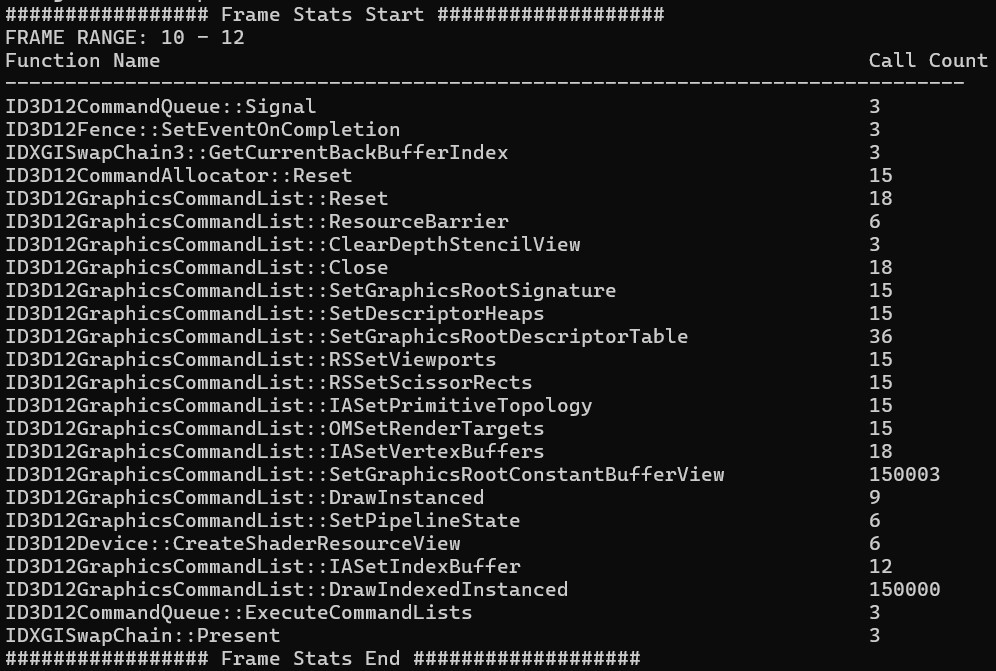
Added a new frame-stats layer. It shows the total number of api calls made with your range of interest. The data can be dumped to a csv file for further analysis. This information can help users determine if their game is more compute, graphics, or raytracing intensive.
gpa-injector.exe --layer frame-stats:frames=[10..12] <target app>
Refer to gpa-help --layer frame-stats for more information.