Overview
Intel® Hyper-Threading Technology (Intel® HT Technology) is Intel's proprietary simultaneous multithreading (SMT) implementation used to improve parallelism of computations performed on x86 microprocessors. Hyper-thread is widely used to speed up multithread application.
In this article, we discuss practice to tune End to End(E2E) video AI application for best performance on a hyper-thread system. It can benefit from hyper-threads by bind application to specific processors. The result showed that around 10% performance improved on Intel® Xeon® CPU for E2E AI application.
The article is organized as follows: hyper-thread technology architecture is introduced in first part. The concept of physical and logical processor as well as associated logical processors are explained in detail. In the second part, two video AI applications examples are used to show how applications be tuned for the best performance on a hyper-thread system.
Hyper-thread Technology
Unlike a traditional dual-processor configuration (Figure 1), that uses two separate physical processors, the two logical processors (Figure 2) in a hyper-threaded core share the execution resources. These shared resources include the execution engine, caches, and system bus interface (Figure 3). The sharing of resources allows two logical processors to work with each other more efficiently, and allows a logical processor to borrow resources from a stalled logical core (assuming both logical cores are associated with the same physical core). A logical processor stalls when it is waiting for data it has sent for so it can resume processing the present thread.
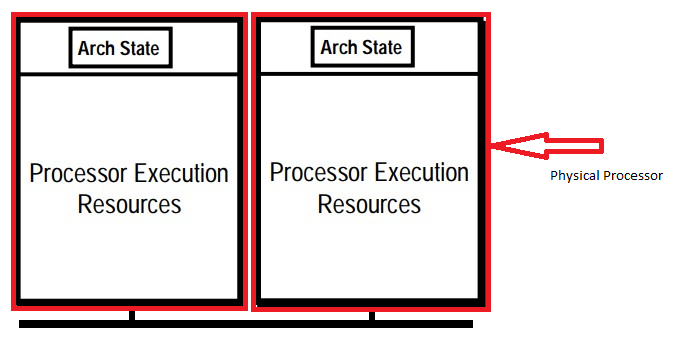
Figure 1. Processors without Hyper-Threading Tech
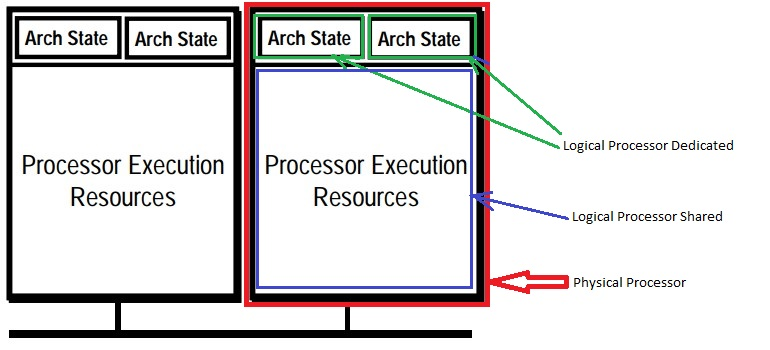
Figure 2. Processors with Intel HT Technology
Logical and Physical Processor
With Intel HT Technology, the execution resources on the Intel® Xeon® processor family are shared by two architectural states. The architecture state consists of registers including the general-purpose registers, the control registers, the advanced programmable interrupt controller (APIC) registers, and some machine state registers.
The majority of the execution resources are in the Rapid Execution Engine and Integrated Cache Subsystem, which process instructions from both threads simultaneously. The Fetch and Deliver engine and Reorder and Retire block partition some of the resources to alternate between the two threads. The Rapid Execution Engine takes instructions from the instruction queues and sends them to the execution units as fast as it can. Execution are shared by two logical processors.
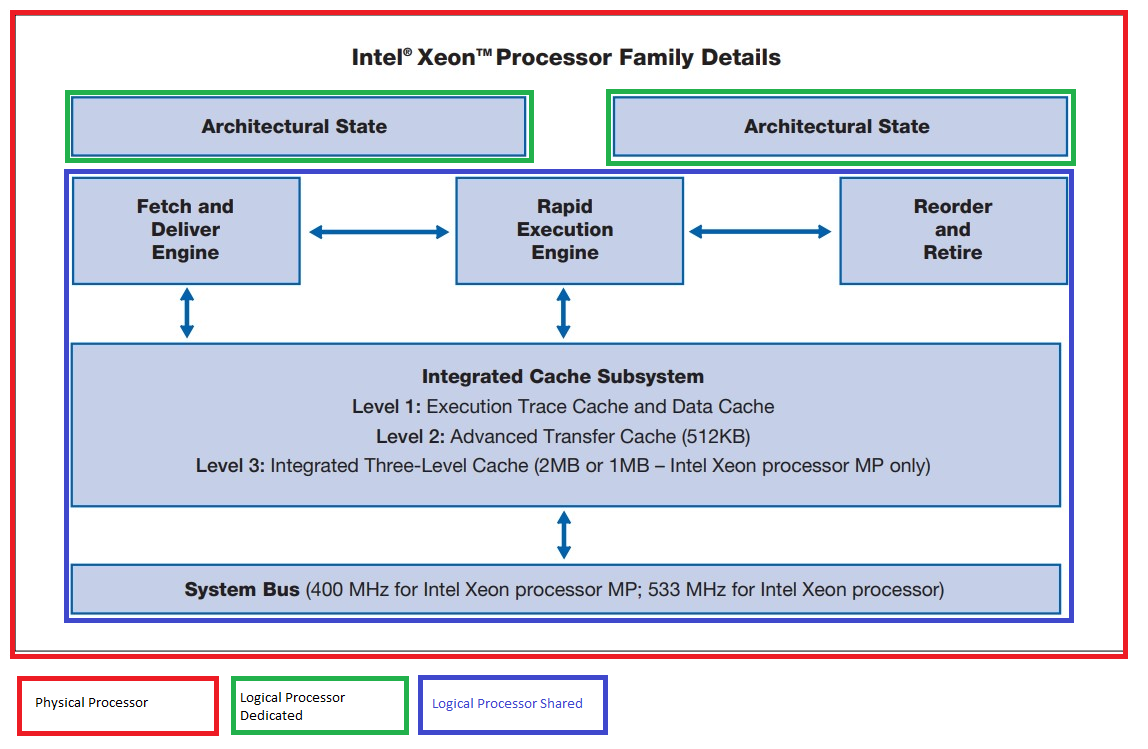
Figure 3. High-level block diagram of the Intel® Xeon® processor family for servers
Associated Logical Processor
Associated logical processor are two logical processors that shares the same execution resources. Disabled Hyper thread in BIOS, the core act as a physical processor in the system; after enabled Hyper thread, the core act as two associated logical processor in the system.
-
Associated logical processors share the Level 1 and Level 2 cache. Cooperative threads of application run on associated processor can benefit from reusing data in cache.
-
Associated logical processors share the same execution resources. Threads run on associated processor compete the executing units and cache of the same physical processor.
The philosophy to make full use of physical resources is: try to allocate Non-associated logical processors to avoid execution units conflict. If conflict cannot be avoided, take the cooperation of the threads into consideration. Data in cache could be reused by cooperative threads if the threads run on associated logical processors.
Practice Guide on Example
User Case Background
A typical end to end video AI application is to use AI model inference the decoded images. The pipeline is:

Figure 4. End to End video AI Application
The E2E pipeline is set up through GStreamer, which is an open-source video framework. AI inference is implemented as a GStreamer plugin. TensorFlow* framework is used in the example Video-AI-Workload.
The GStreamer command to create the pipeline is:
gst-launch-1.0 filesrc location=${video_file} ! decodebin ! videoscale ! video/x-raw,width=m_width,height=m_height ! videoconvert ! video/x-raw,format=RGB ! queue ! gst_detection_tf conf=${dl_config_file} ! autovideosink
In the pipeline, decoded image is resize then converted from YUV space into RGB space (as AI Inference takes RGB image as input). After being normalized, it is fed into AI model.
GStreamer is a multithread framework. Video decoder, rescale and color conversion run within a GStreamer thread, AI inference run in another GStreamer thread.
Besides GStreamer threads, extra configurable thread pools are created for AI inference by TensorFlow framework. So video decoding tasks and AI inference tasks run parallel in different threads.
There are control threads and compute threads in an application. We are interesting compute threads only. From now on, when we mention thread, we mean the compute thread.
Experiment Environment
In this experiment, a H264 1080P video stream is decoded, then the decoded image is sent to AI inference for object detection.
The test environment are:
Software:
OS: Unbutu 22.04
BIOS setting: Hyper-thread Enabled
GStreamer 1.18
TensorFlow: 2.11
Intel® Extension for TensorFlow*[CPU]: 1.1.0

Hardware:
4th Generation Intel® Xeon® CPU (formerly code name Sapphire Rapids)
The following is lscpu execution result on the machine. The CPU are Intel® Xeon® Platinum processor 8480+ processor. Two sockets were detected onboard, each socket has 56 physical cores. Since Hyper-Threading is enabled, each CORE (physical processor) presents as two logical processors (two CPUs) in the system, Figure 5.
CPU(s):                  224
  On-line CPU(s) list:   0-223
Vendor ID:               GenuineIntel
  Model name:            Intel® Xeon® Platinum processor 8480+
    Thread(s) per core:  2
    Core(s) per socket:  56
    Socket(s):           2
NUMA:
  NUMA node(s):          2
  NUMA node0 CPU(s):     0-55,112-167
  NUMA node1 CPU(s):     56-111,168-223
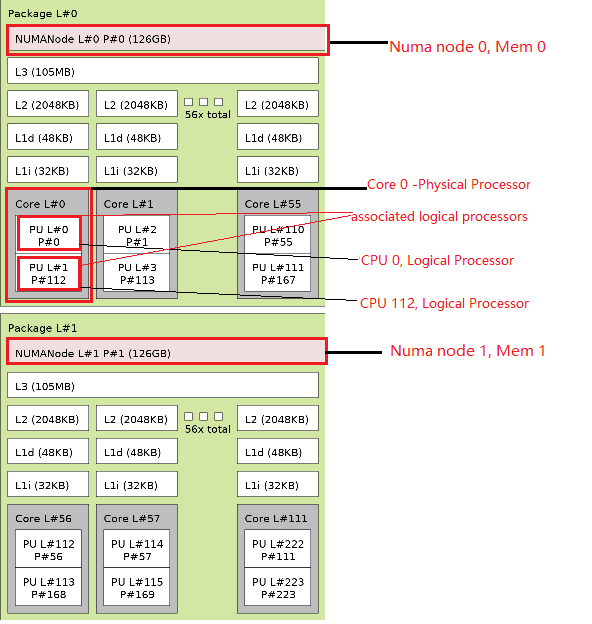
Figure 5. Architecture of machine with two Intel® Xeon® Platinum Processors
In figure 5, Each gray block is a core (physical processor). CPU 0 and CPU 112 are logical processors of core 0, so CPU 0 and CPU 112 are associated logical processors, they share the same L1 and L2 cache.
There are two Non-Uniform Memory Access (NUMA) nodes in the system, figure 5. NUMA refers to multiprocessor systems whose memory is divided into multiple memory nodes. The access time of a memory node depends on the relative locations of the accessing CPU and the accessed node. This contrasts with a symmetric multiprocessor system, where the access time for all of the memory is the same for all CPUs.
In figure 5, there are 126G memory (named Mem 0) in node 0, and another 126G memory (named Mem 1) in node 1. CPU 0-55, 112-167 are on NUMA node 0. CPU 56-111,168-223 are o NUMA node 1.
For CPU 0, Mem 0 is local memory, Mem 1 is remote memory. CPU 0 access Mem 0 faster than Mem 1.
Hyper-thread Tuning Guide and Example
Different from OS thread scheduler, where OS handles all kinds of applications. E2E video AI application is a specific application, the pipe threads and pipeline stages are known in advance.
There are multiple threads in video AI applications. Data are processed by different threads at different stages of the application pipeline.
Some frameworks or applications provide the interface to set the number of computing threads, and tasks are divided equally and dispatched to each thread.
For system performance tuning, what we do is to decide:
- How many CPUs be allocated for the applications
- Which CPUs should be used in hyper-thread system
- How many instances can be created
We provide some guides on how to do it through two examples. The first example is for latency mode where one instance is running. The second example is throughput mode, where multi-instances are running.
The test examples are based on the Video-Stream example.
In these examples, there are 3 settings related to CPU schedule:
1. cores_per_pipeline    # number of CPUs to allocated for a instance
2. intra_op_parallelism  # number of computing thread in a instance
3. number instance       # number of instance to start in the system
Example 1: Latency Mode Tuning
Run an instance to decode one 1080P video stream, then inference the image. The inference model is SSD-ResNet34 INT8, input size 1200x1200.
It make fully use of execution units of each core by allocating non-associated logical processors.
Tuning guide 1.
In general, for best performance (latency mode), the application should schedule application to Non-associated logical processors.
The setting for best performance is:
cores_per_pipeline = 16
intra_op_parallelism = 16
number instance = 1
Linux numactl command limit the process to run on the setting CPUs. The setting corresponding command is:
numactl --physcpubind=0-15 --localalloc gst-launch-1.0 filesrc location=dataset/test.mp4 '!' decodebin '!' videoscale '!' video/x-raw,width=1200,height=1200 '!' videoconvert '!' video/x-raw,format=RGB '!' queue '!' gst_detection_tf conf=config/settings.yaml '!' fpsdisplaysink text-overlay=false silent=false video-sink=fakesink sync=false fps-update-interval=1000 --verbose
For the CPU numbers, it's NOT simply the case the more CPU used, the better.
The CPUs numbers that get best performance for an applications is affected by calculation complexity and parallelism, as well as data amount in the pipeline.
The task consumed CPU time consists of workload time and overhead time, i.e T = T_w + T_o. The overhead includes data prepare, task dispatch and thread synchronization. With n CPUs to run the task, T_w' ~ T_w / n, T_o roughly keeps at a constant when n is small. When n increase to certain range (e.g, n > 20), the thread synchronize overhead cannot be ignored any more. While n > 30, it may cause threads conflict on cache, the performance drop dramatically unless the application are optimized for this situation specially.
Tips: CPU utilization decrease as the CPUs number to run the instance increasing. When the CPUs utilization is higher (e.g., more than 70%), try to increase the number of CPUs for better performance. By experience, when CPUs utilization is low (e.g., less than 40%), the performance increase little when adding more CPUs. Usually performance begins to drop due to threads synchronize and conflict overhead.
Tuning guide 2.
Set the number of threads equals to number of CPUs allocated to the instance.
Make sure each thread run on a single CPU by set the computing thread number equals to number of CPUs.
Example 2: Throughput Mode Tuning
In this example, we run multiple instances of video AI application. Each instance decode a 1080P video stream, then inference with a SSD-MobileNet, the model is of type INT8, input size is 300x300.
The target is to maximum the throughput of the system. This can be done in two steps:
- Decide number of CPUs for a single instance.
- Decide how many instances could be created.
Although instances run on different CPUs, they share the L3 cache and memory. The performance of each instance begins to decrease when the instances number comes to a certain level.
There are several rounds to try before get to the best setting. If the E2E performance is not satisfied in step 2, try to adjust CPUs number of one instance in step 1, then goes to step 2 again.
- Step 1. Decide CPUs number to run one instance. Set 3 CPUs of each instance in this example
cores_per_pipeline = 3
The pipeline must satisfy 30 FPS requirement. Allocate 2 CPUs for each instance, the FPS is ~33. However, if we run more than 16 instances, the FPS drops to less than 30 FPS. So allocate 3 CPUs for each instances.
There is overhead of threads. The more processors allocated (it means more threads created) to run a task, the more thread overhead was brought in the system. Always allocate least number of CPUs to run one instance to satisfy performance requirement.
Tuning guide 3.
For best throughput, allocate least number of CPUs for one instance to satisfy the performance requirement.
Tuning guide 4.
Always try put instance in one NUMA node. Try your best to avoid any instance run across NUMA nodes If a instance across NUMA node, CPUs may access remote memory.
The command to allocate CPU is:
cores_per_pipeline = 3
NUM_THREADS = $cores_per_pipeline
for ((i=0;i<$NUM_INSTANCE_START;++i))
do
   cpu_start=$((i*$NUM_THREADS))
   cpu_end=$((i+1))
   cpu_end=$((cpu_end*$NUM_THREADS-1))

   numactl --physcpubind=$cpu_start-$cpu_end --localalloc gst-launch-1.0 filesrc location=${video_path} ! decodebin ! videoscale ! video/x-raw,width=300, height=300 ! videoconvert ! video/x-raw,format=RGB ! queue ! gst_detection_${framework} conf=${dl_config} ! $sink &
done
- Step 2. Decide how many instances can be created in the system
3 CPUs are used for each instance in step 1. In another word, each CPU run 1/3 instance. There are 224 CPUs in the system, figure 5. So the maximum instance is 74 (74 x 3 < 224 < 75 x 3).
If we start 75 instances, 75x3=225 CPUs are needed totally. This means there is one CPUs run 2/3 instances,the performance is NOT satisfied as a result.
Tuning guide 5.
Set the number instances N-instance created in the system as this:
N-instance is the maximum integer satisfies,
          N-instance * N-thread <= CPUs in the system.
where N-thread is number of computing threads in an instance.
For hyper-thread system, there is still something could be improved. In an application, data are processed on different pipeline stages. The output of one pipeline stage is the input of next stage. So there is the chance that computing threads of different pipeline stage reuse the data in the cache.
As we know associated logical processors share the same L1/L2 cache, we can use associated logical processor for an instance.
Tuning guide 6.
For best throughput (throughput mode), allocate associated logical processors to each instance as possible as we can.
-
case 1: In above example, CPU {0, 1, 2}, {2, 3, 4 } … { (3 * i)-1, (3 * i), (3 * i) + 1 } are allocated to each instance. These CPUs running an instances do NOT shared L1/L2 cache.
-
Case 2: Instead, we try to allocate associated logical processors, for example { {0, 112, 1}, {113, 2, 114}, {3, 115, 4}, …} to each instances. CPU 0 and CPU 112 share L1/L2 cache (but CPU 1 does NOT).
The data shows the average FPS of 74 instances increased around 10%. also CPUs utilization increase.
Intel® VTune™ Profiler analysis shows, that case 2 last level cache miss count decreased 44% compared to case 1.
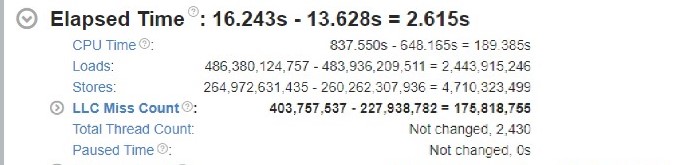
Figure 6. the Last level cache miss decreases by run APP on associated logical processors
Summary
In this article, we introduce Intel® Hyper-Threading Technology first, then discuss the practice guide for video AI applications performance tuning.
For latency mode, the best practice for hyper-threading system is to try to allocate non-associated logical processors.
For throughput mode, first decide the number logical processors for each instances, then decide the number of instances created in the system. For hyper thread system, try to allocate associated logical processor to each instance.