As modern games continue to become more popular and complex, creating a game that performs well across multiple platforms (with different hardware specifications) becomes a daunting task. Multiple variables can cause performance issues that lead to unsatisfactory gameplay. Equip yourself with a powerful toolset of performance analyzer tools from Intel to tackle this complexity and develop games more efficiently.
What You Will Learn
Use this step-by-step guide to:
- Analyze the performance of your game
- Determine if your game is GPU- or CPU-bound
- Resolve bottlenecks with Intel performance analyzer tools
At each step, find relevant resources to dig deeper.
Who This is For
Game developers who are looking to understand and improve the performance of their code.
What You Will Need
- Intel® Graphics Performance Analyzers (Intel® GPA)
- Intel® VTune™ Profiler (VTune Profiler)
The Game Tuning Workflow
Step 1: Capture a trace.
Step 2: Analyze the trace to identify if your game is GPU- or CPU-bound.
- If your game is GPU-bound, go to step 3.
- If your game is CPU-bound, go to step 5.
Step 3: Capture a stream to understand frame details.
Step 4: Analyze your captured stream or frame to resolve GPU bottlenecks
Step 5: Analyze your game for CPU bottlenecks
Step 6: Investigate Critical CPU Bottlenecks
Step 7: Get deeper insights

Get Familiar with Intel® GPA
| Term | Definition |
|---|---|
| Graphics Monitor | This is the hub tool for the Intel GPA analysis tools. Use Graphics Monitor to configure capture options for capturing a trace, stream, or frame. |
| Graphics Trace Analyzer | Use this tool to identify problems with distributing workload across computing resources:
|
| Graphics Frame Analyzer |
Use this tool to examine a frame. Understand the performance impact of specific API calls at various stages of the rendering pipeline. You can dive into draw-call issues and understand how they impact the frames-per-second (FPS) at various stages of the rendering pipeline. |
| CPU-Bound | When your CPU is continuously busy and your GPU is idle, you are time-bound by the CPU. The GPU cannot do more work because the CPU is too busy to assign it any more work in that frame. Your code is then CPU-bound. |
| GPU-Bound | If your GPU is continuously busy while your CPU has idle spots, the GPU is slowing game performance and your game is GPU-bound. Optimize the work on the GPU so that the CPU can assign more work to the GPU. |
| Trace | When Graphics Trace Analyzer captures a trace, you have a record of activity on both the CPU and the GPU during application execution for a specified number of seconds. |
| Frame | A frame Is a collection of data associated with a single computer-generated image. |
| Stream | A stream is a collection of captured frames. |
Step 1: Capture a Trace
You capture a trace to understand the workings of the GPU and CPU cores during the execution of your game. Use Graphics Monitor to capture a trace and then analyze it using Graphics Trace Analyzer (Step 2).
In the Graphics Monitor application,
- Choose your game executable.
- Set any command-line arguments that your game may require.
- Select the Trace capture type.
- Click Start.

Tip: Trace durations can get long. Before you capture a trace, set a duration (in seconds) for the trace capture. Use the Trace Duration (sec) option in the Options > Trace menu in Graphics Monitor.

Tip: Enable developer mode in Windows* to successfully capture metrics data with Graphics Monitor.
This launches your game executable with a HUD overlay.The HUD overlay displays basic metrics and key indicators.
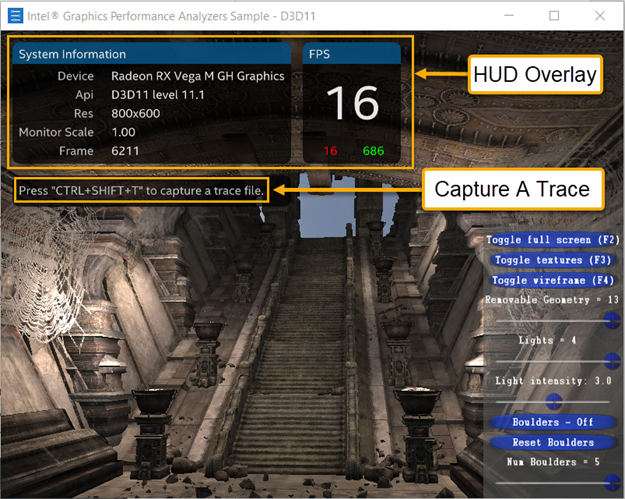
Note: While trace captures cannot collect all metrics from all third party GPUs, they can collect several metrics from other GPU vendors.
Learn More:
Step 2: Analyze the Trace
Your next step is to analyze the captured trace and determine if your game is GPU/CPU-bound. Once you capture a trace, a thumbnail with a trace icon appears in the upper right corner of Graphics Monitor. Click the trace thumbnail to open the Graphics Trace Analyzer application.
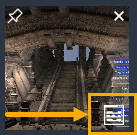
Note: Loading trace data into Graphics Trace Analyzer can take several seconds.
A typical trace capture involves 3 to 5 seconds of gameplay. This is sufficient for Graphics Trace Analyzer to collect and display several types of information, like:
- CPU execution tasks
- GPU rendering packets
- Simultaneous visualization of CPU and GPU activity
Once you load the trace, zoom in to examine the trace data. If you see gaps in the CPU execution while the GPU is busy, this indicates that your game is GPU-bound at this time slice.


Learn More:
- Open and explore a trace (Video | Article)
- An overview of Graphics Trace Analyzer
- A video on using Graphics Trace Analyzer
Step 3: Capture a Stream
For a GPU-bound game, your next step is to capture a stream. A stream captures these details from one or more frames:
- Textures
- Buffers
- Shader calls
- Hardware counters
Analyze the data from these frames to locate the bottlenecks in your rendering pipeline, so you can optimize your game.
- Open Graphics Monitor.
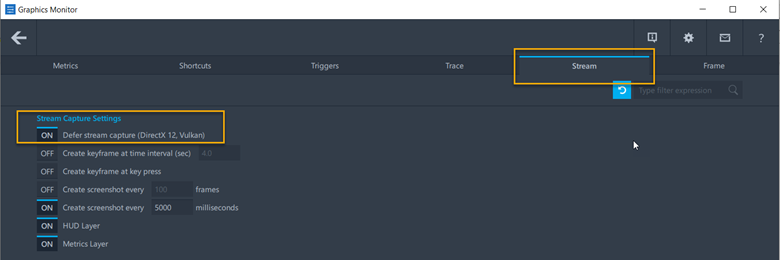
- Select the Stream capture type.
- In the Options menu,
- If you are using Microsoft* DirectX 12 or Vulkan* APIs, select the Defer stream capture option. This enables you to capture multiple streams at any point in your gameplay.
- If you are using Microsoft* DirectX 11 API, the Defer stream capture option Is not available. The capture begins at the start of game play and ends when you close the capture window.
Learn More:
Step 4: Analyze a Stream
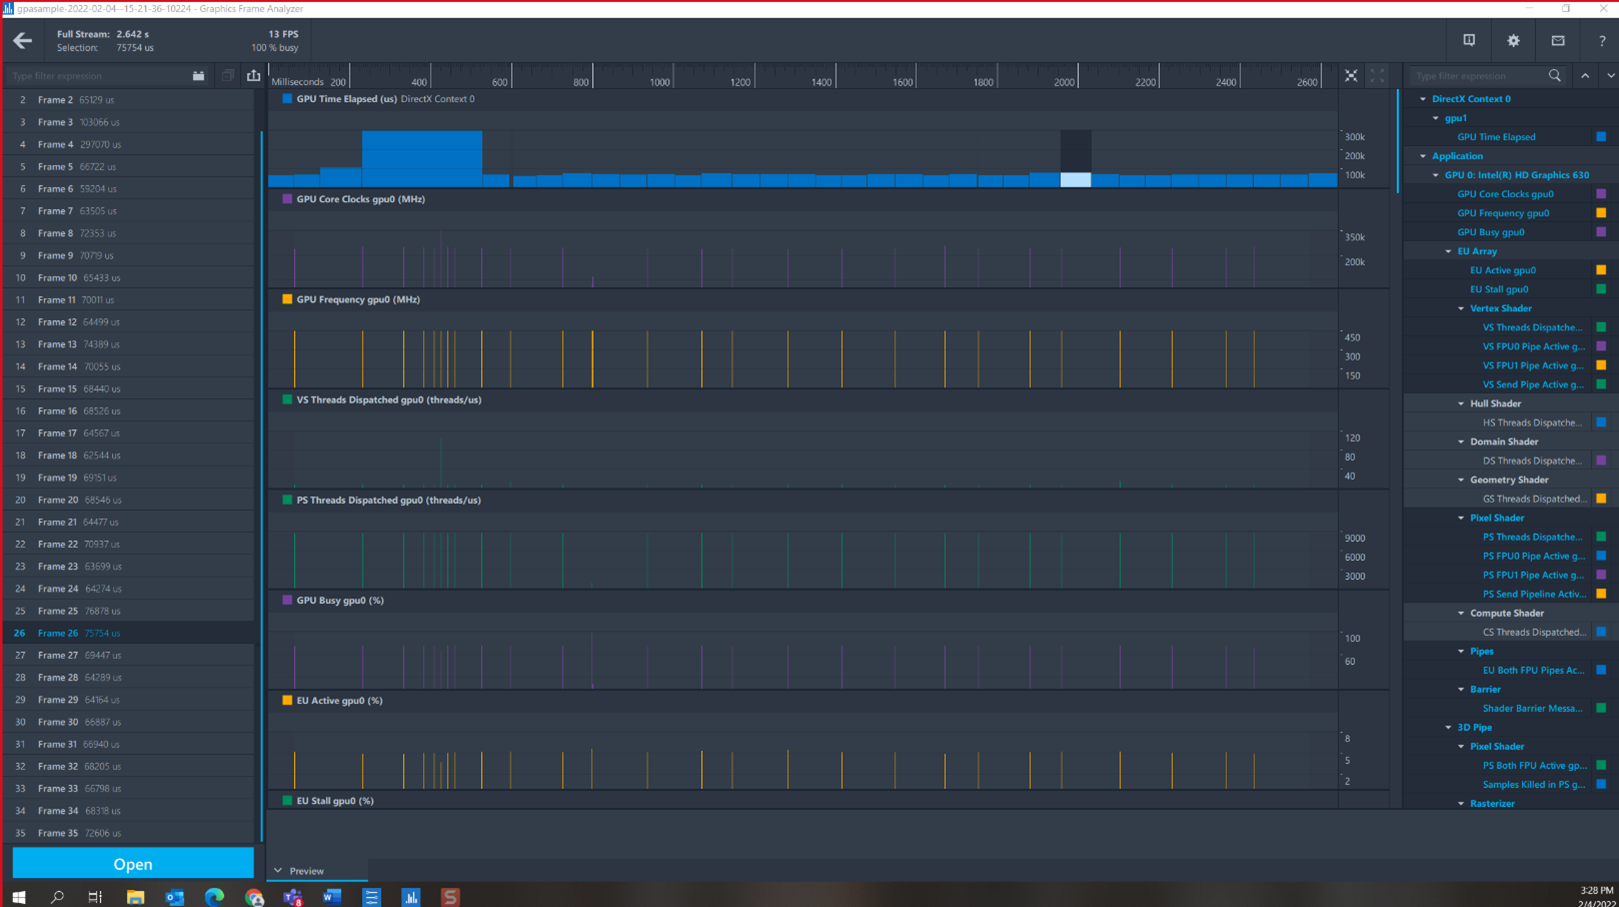
Once you have captured a stream with Graphics Monitor, you can analyze it using Graphics Frame Analyzer.
- In the Graphics Monitor UI, click on the thumbnail for the captured stream. This opens the stream in the multiframe view in Graphics Frame Analyzer.

- Select a frame and open it. When a frame captures data, it actually captures the relevant API calls. Only when you open a frame does the data collection actually happen. This is why opening a frame can take some time.
- Profile each draw call in a frame; the geometries, textures, buffers etc.
- Click the flame icon in the upper left corner to open the Advanced Profiling Mode. In this mode, you can:
- Observe the top bottlenecks
- Understand the most relevant metrics and ensure they are satisfactory
- Analyze the resources (geometries, textures, and buffers added to the frame) to see if any of these are overly complex
These are just some examples of how you can troubleshoot performance issues in your captured stream.
Tip: When you use Graphics Frame Analyzer to open a captured frame on different GPUs, you can compare performance across those GPUs.
Learn More:
- An overview of Graphics Frame Analyzer
- A video on using Graphics Frame Analyzer
- Open and explore a single frame (Video | Article)
- Advanced Profiling Mode in Graphics Frame Analyzer
Get Familiar with Intel® VTune™ Profiler
When you write programs for games and/or game engines, use insights from Intel® VTune™ Profiler to tune single threaded and multithreaded performance. VTune Profiler is a performance analysis tool that helps you identify the most time-consuming functions in your application and suggest ways to optimize them. This tool can also help you identify if your application is CPU/GPU-bound, resolve CPU bottlenecks, and improve the efficiency of offloading portions of your code onto the GPU.
Simplify game development by using VTune Profiler in these ways:
- Optimize CPU compute-intensive tasks:
- Get finer CPU granularity by drilling down to the code level and identifying the slow task, function, line of code, or call stack.
- Identify reasons for slow CPU performance- cache misses, branch misprediction etc.
- Tune CPU threading performance: Use Threading Analysis to examine several common problems related to parallelism, such as thread imbalance and excessive context switching.
- Tune workload balance and interaction between CPU and GPU: Improve computational performance by analyzing detailed profile data and identifying whether your game or engine is CPU or GPU-limited. Use Intel® VTune™ Profiler for a deeper analysis. Identify CPU bottlenecks, see a detailed summary, and drill down to the function level.
- Annotate and sort by frames: Annotate data with frames to see each frame on the timeline. Identify slow and fast frames and filter your data to see only the functions that were running during the slowest frames, or correlate timeline patterns with frame activity.
- Optimize cache usage: Tune bandwidth-limited software and identify those memory objects which are bottlenecks.
This table describes several features in Intel VTune Profiler to help you profile the performance of your game or game engine.
|
Feature |
Support in Intel VTune Profiler |
|---|---|
| OS Support | Full support on both Linux and Windows |
| Hotspots/stacks/threads | Two ways to get top functions and call stacks:
|
| Source code view |
|
| Hardware utilization analysis |
|
| Instrumentation API |
Use the Instrumentation and Tracing Technology (ITT) API in VTune Profiler to generate and control the collection of trace data during its execution. Unity and Unreal Engine already use the ITT API to support profiling with VTune Profiler. |
| Graphics API Support |
Microsoft* DirectX, OpenCLTM, SYCL |
| Engine Support | Unity, Unreal Engine |
| Interface | GUI, CLI |
| Profiling level | Application, system-wide |
| Language Support |
Most languages, including but not limited to:
|
| XPU support | CPU, Hybrid CPU, Intel GPU |
Learn More:
- Get Started with Intel® VTune™ Profiler
- Intel® VTune™ Profiler User Guide
- Intel® VTune™ Profiler Performance Analysis Cookbook
Step 5: Analyze CPU Bottlenecks
CPU performance can impact the performance of your game in several ways. To identify a starting point, run a Hotspots analysis in Intel VTune Profiler. Besides providing an overall assessment of thread performance, this analysis provides information about the top functions in your application that consume CPU time.
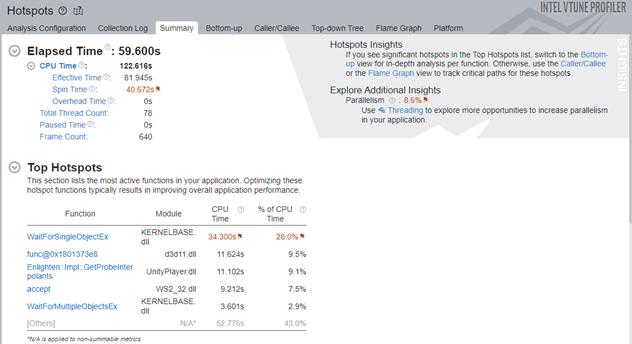
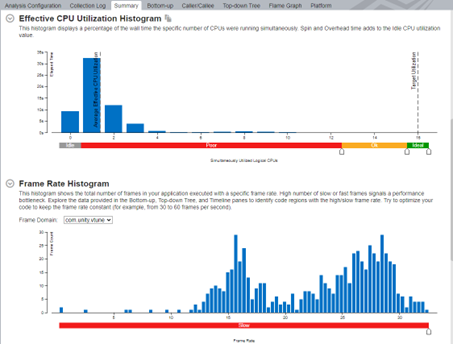
VTune Profiler uses the Instrumentation and Tracing Technology (ITT) API to help identify tasks and correlate them with frames and frame rate. Unity and Unreal Engine both use this API to highlight engine-specific tasks.
Note: Intel VTune Profiler supports a wide variety of applications and workloads. Certain insights and recommendations provided by VTune Profiler, such as 100% utilization of available CPUs, may not be suitable for gaming workloads.
Learn More:
Step 6: Investigate Critical CPU Bottlenecks
The results of a Hotspots analysis include two important sets of information:
Threading Issues
Here are some common threading issues you can observe from a hotspots analysis:
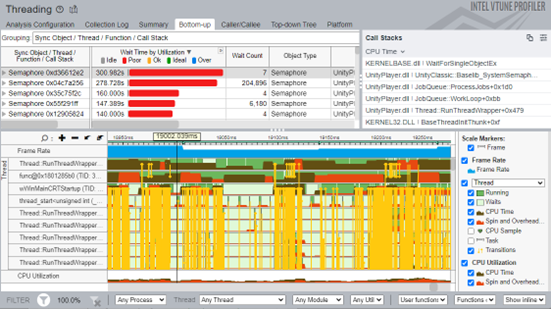
Poor parallelism
When a task has the resources it needs to execute, but is waiting on another task to finish first, the reason could be lock contention, or the need for additional threads.
For example, in the figure below, threads are running in parallel, but most threads finish and then spin while they wait for the rest of the threads to complete.

Run a Threading analysis in VTune Profiler to visualize locks and waits and identify synchronization problems.
Threading Overhead
When a task has more threads than available CPUs, the scheduler can take extra time to switch between threads. Run a Threading analysis in VTune Profiler to see how context switches and transitions affect the performance of your game.
Hotspots in Functions
Next, start resolving hotspots that you observe in your functions.
Identify a function to optimize, and then run hardware event-based sampling to get more details about its actual performance.
Unnecessary computes
Based on the results of your hotspots analysis, you may observe a significant number of unnecessary compute operations. These computations can happen in several ways. For example,
- Repeating the same calculation in a loop
- Calling a function that does more work than what is needed for a particular task (see figure below)
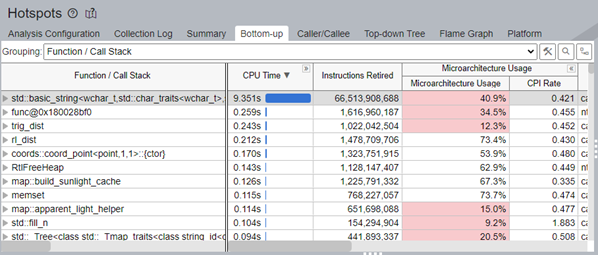
Doubleclick on a function name to open the source code view. See which lines of code execute the most. This may help you identify redundant operations and reduce the number of instructions for the functions.
Older Software
You may also see a hotspot in an engine task or third-party library. If you are using an older version of the game engine or any other software to run your game, you may see an improvement when upgrading to a newer version of that game engine or software.
Learn More:
Step 7: Get Deeper Insights
Continue exploring CPU bottlenecks by focusing on these aspects:
Inefficient Memory Access
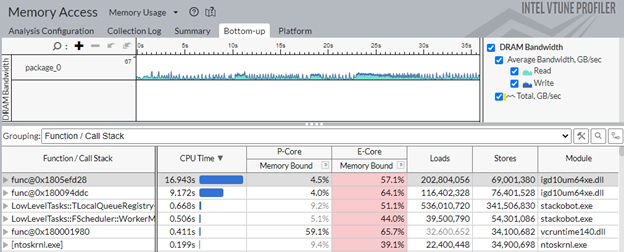
This occurs when data is stored in one pattern but is accessed in another. If the data cannot be read sequentially, the CPU cannot make efficient use of the cache. Run the Memory Access analysis type in VTune Profiler to see if slow memory accesses cause a performance issue.
Poor Microarchitecture Usage
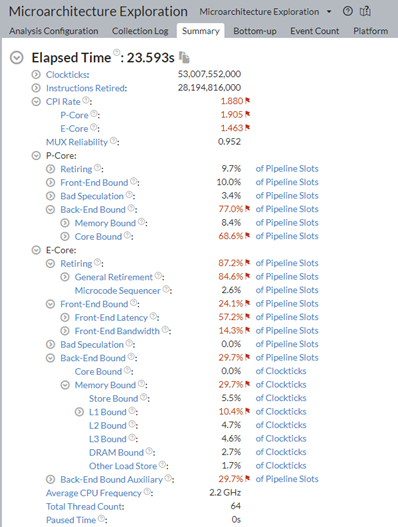
When a hotspot has a high CPI (clock cycles per instruction) rate, that means the instructions themselves are taking a long time to execute. Ideally the CPU can execute an instruction in ¼ clock cycle, but a number of issues can cause it to take much longer. To identify the bottleneck at this level, use the Microarchitecture Exploration analysis.
Learn More:
Summary
In game performance, while the GPU does most of the heavy lifting, it is the CPU that assigns work to the GPU. Efficient game performance relies on efficient GPU as well as CPU performance. Resolving CPU bottlenecks ensures that you employ the full potential of your CPU, which in turn drives GPU use to its full potential. A combination of performance profiling tools can help you get the most performance from the games you develop.
Get Intel® Graphics Performance Analyzers Get Intel® VTuneTM Profiler